
Clinical History
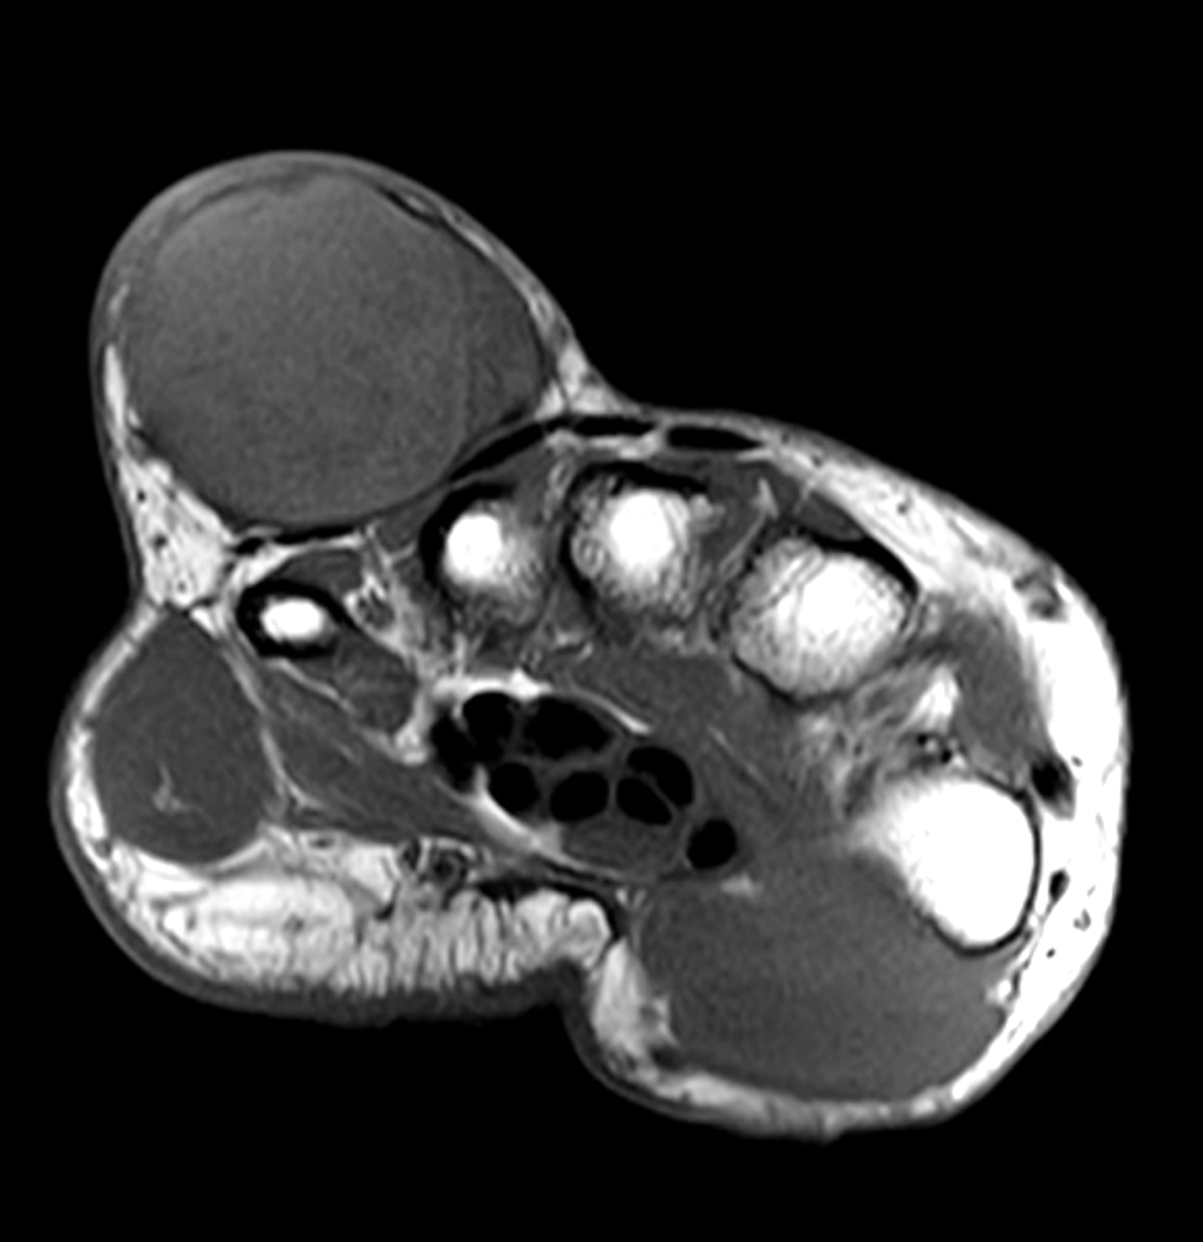
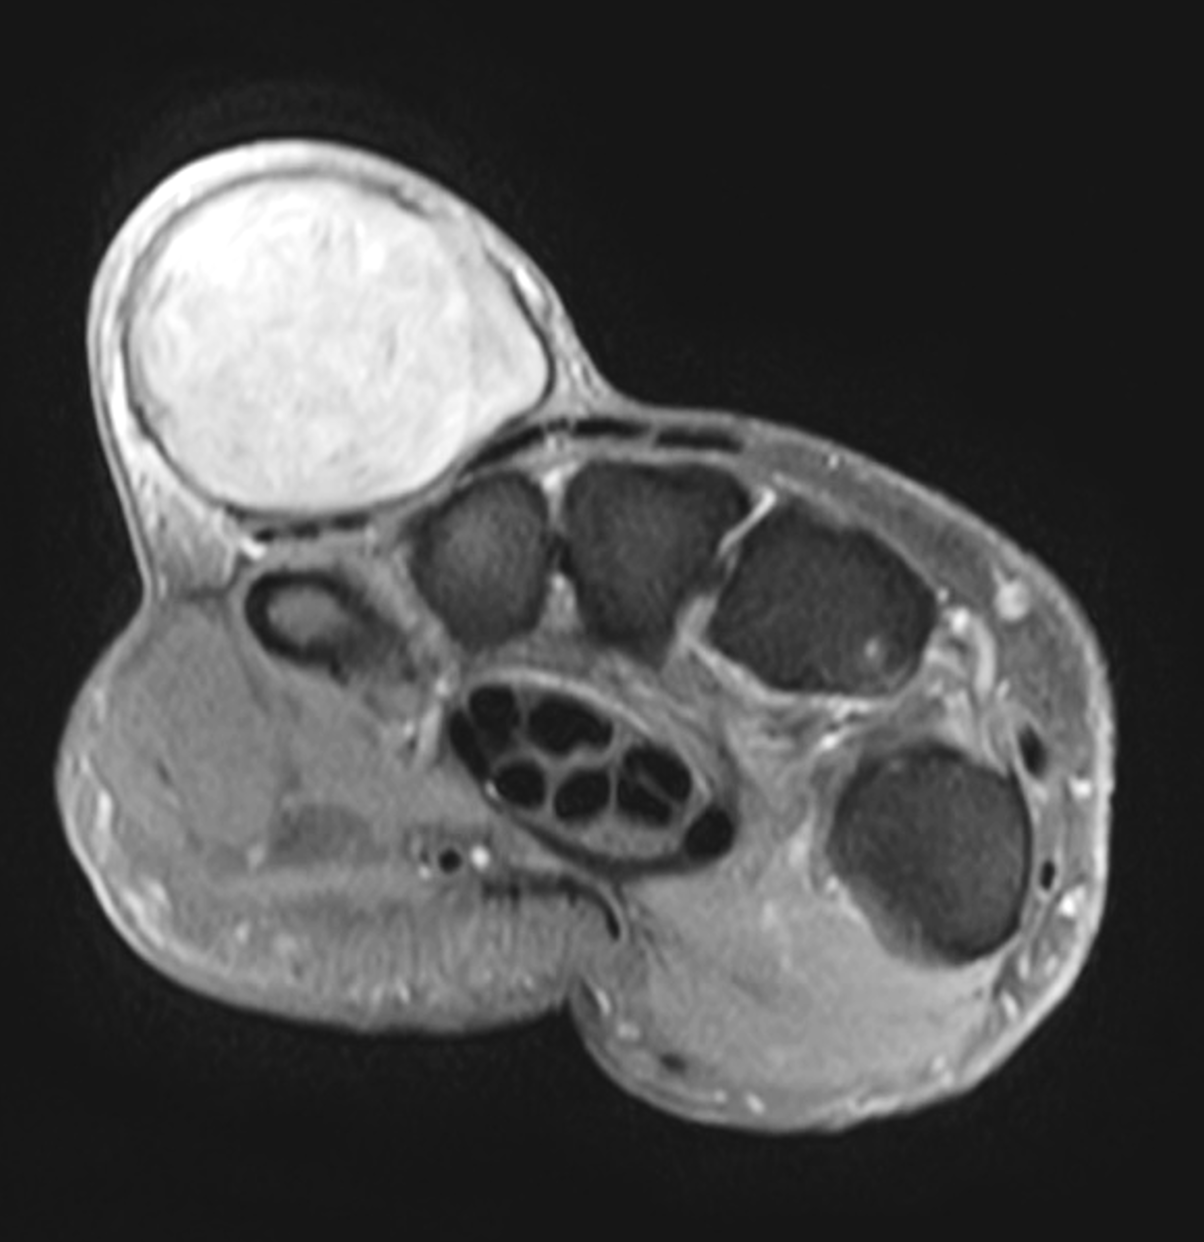
A 61-year-old woman presents with an enlarging painless mass along the dorsoulnar aspect of the right hand. She reports a remote history of trauma. Representative images from a wrist MRI include (1A) axial T1-weighted and (1B) fat-suppressed proton-density weighted, (1C) sagittal fat-suppressed, T2-weighted images, and (1D) coronal fat-suppressed T1-weighted image acquired after intravenous contrast administration. What are the findings? What is your diagnosis?


Findings
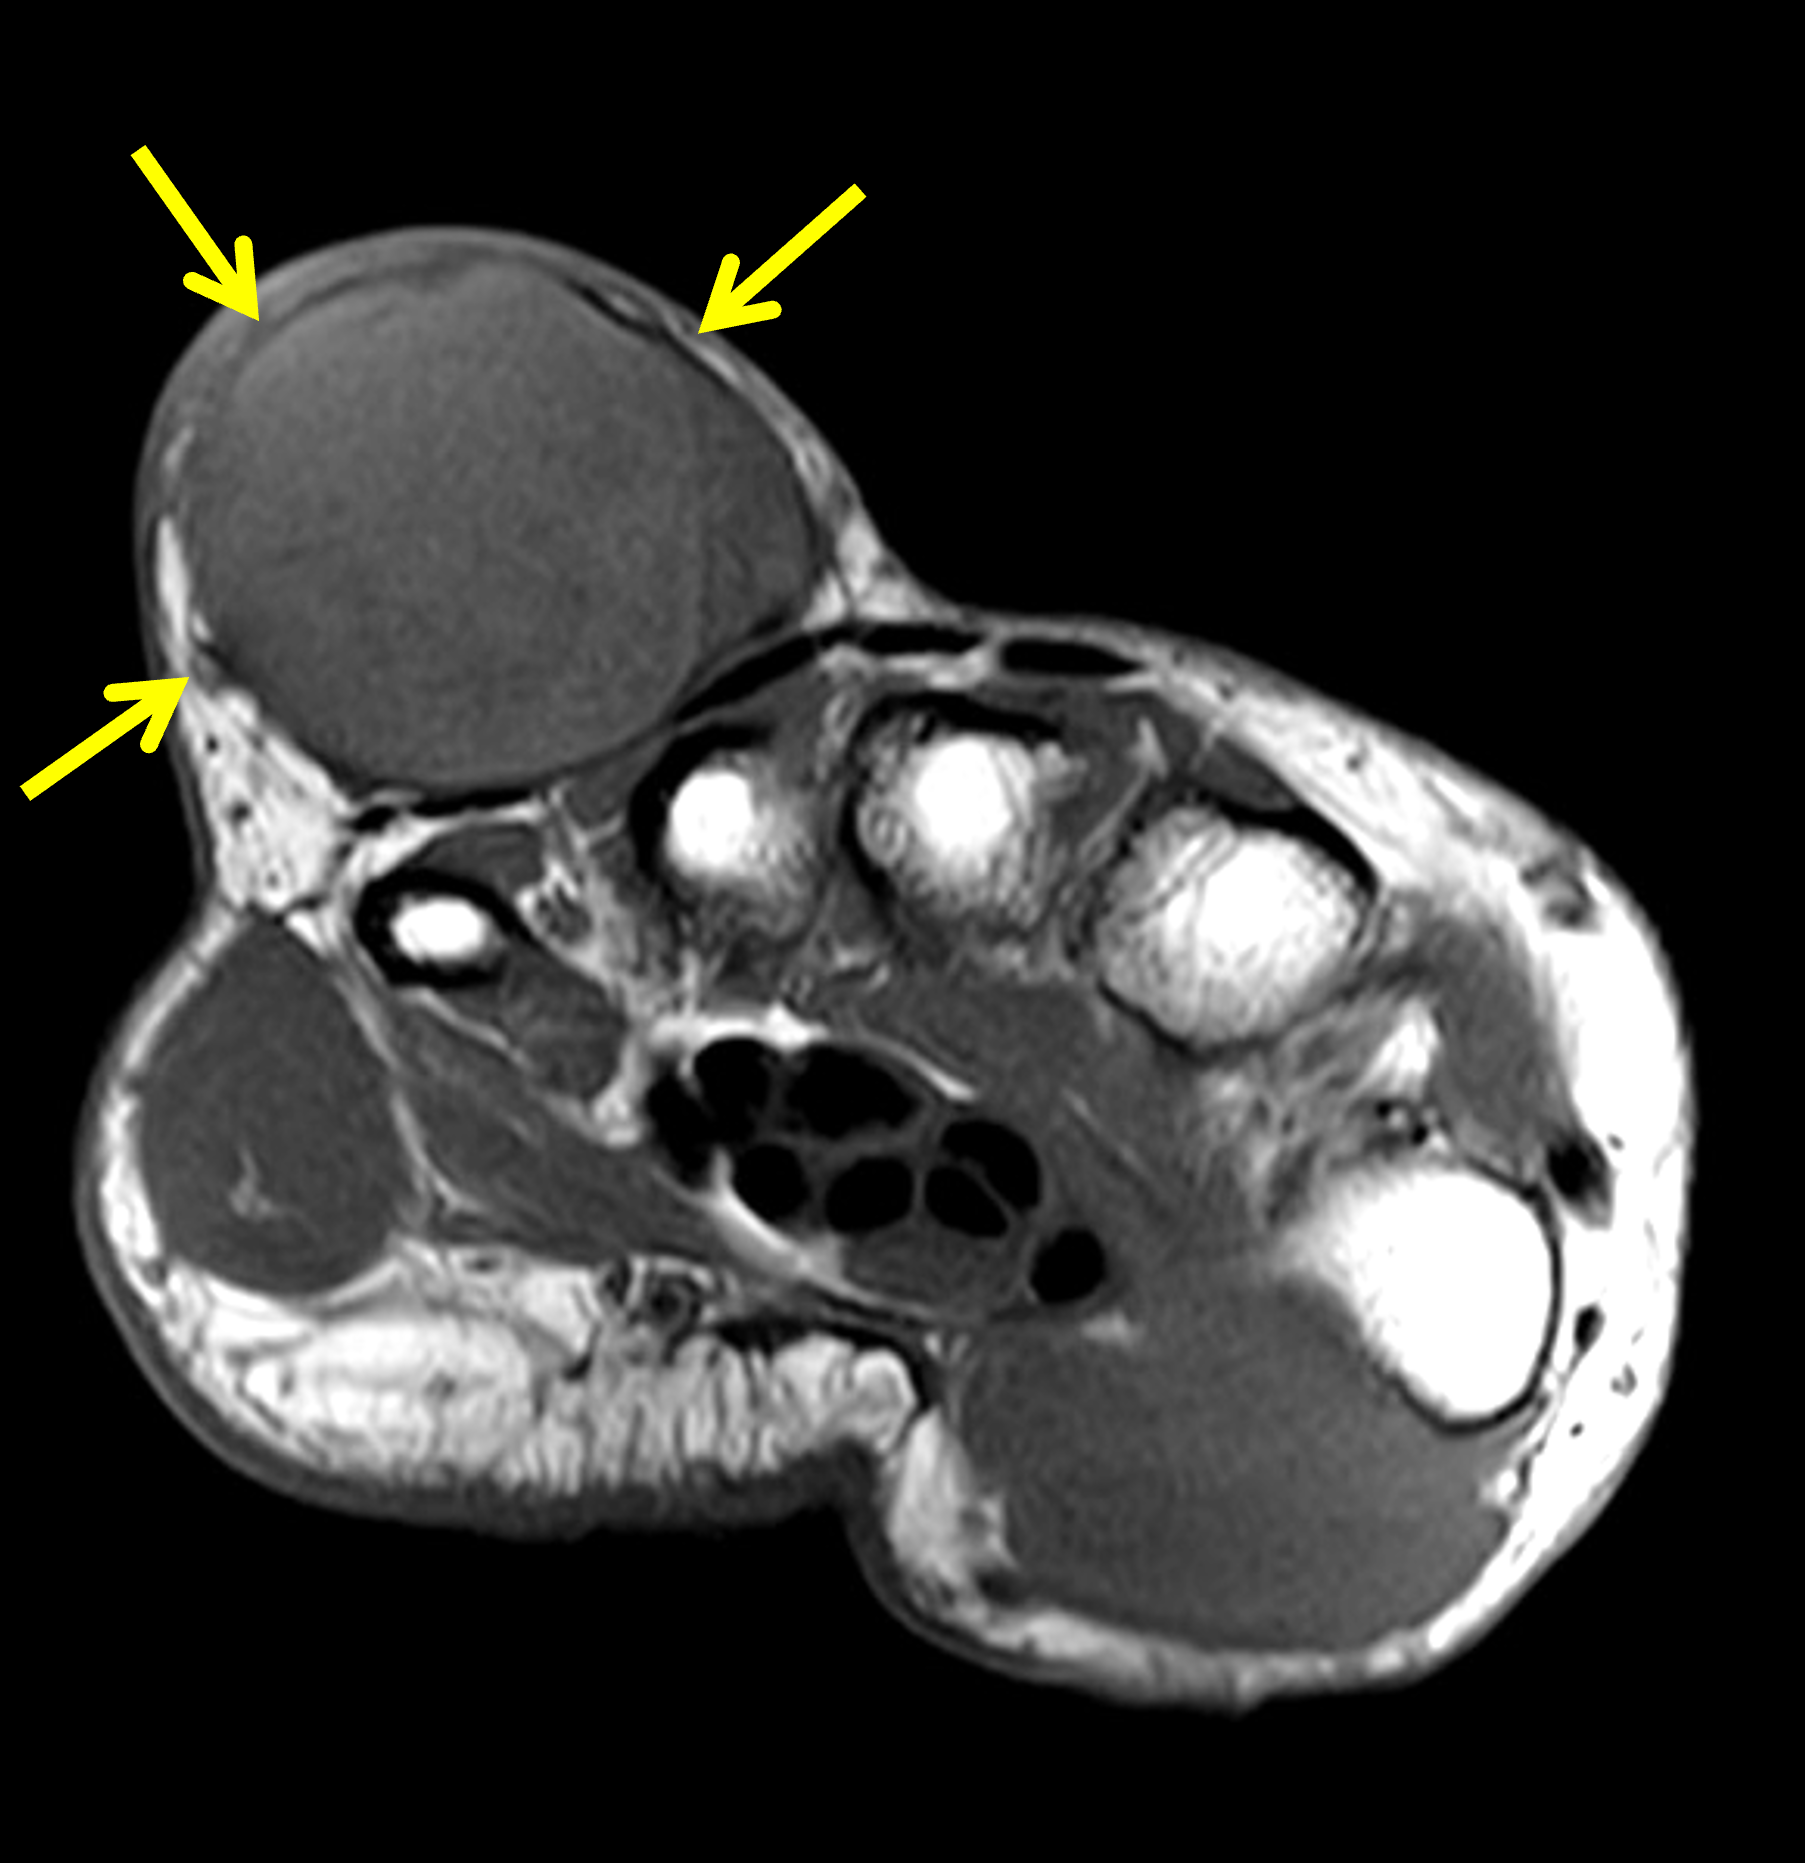
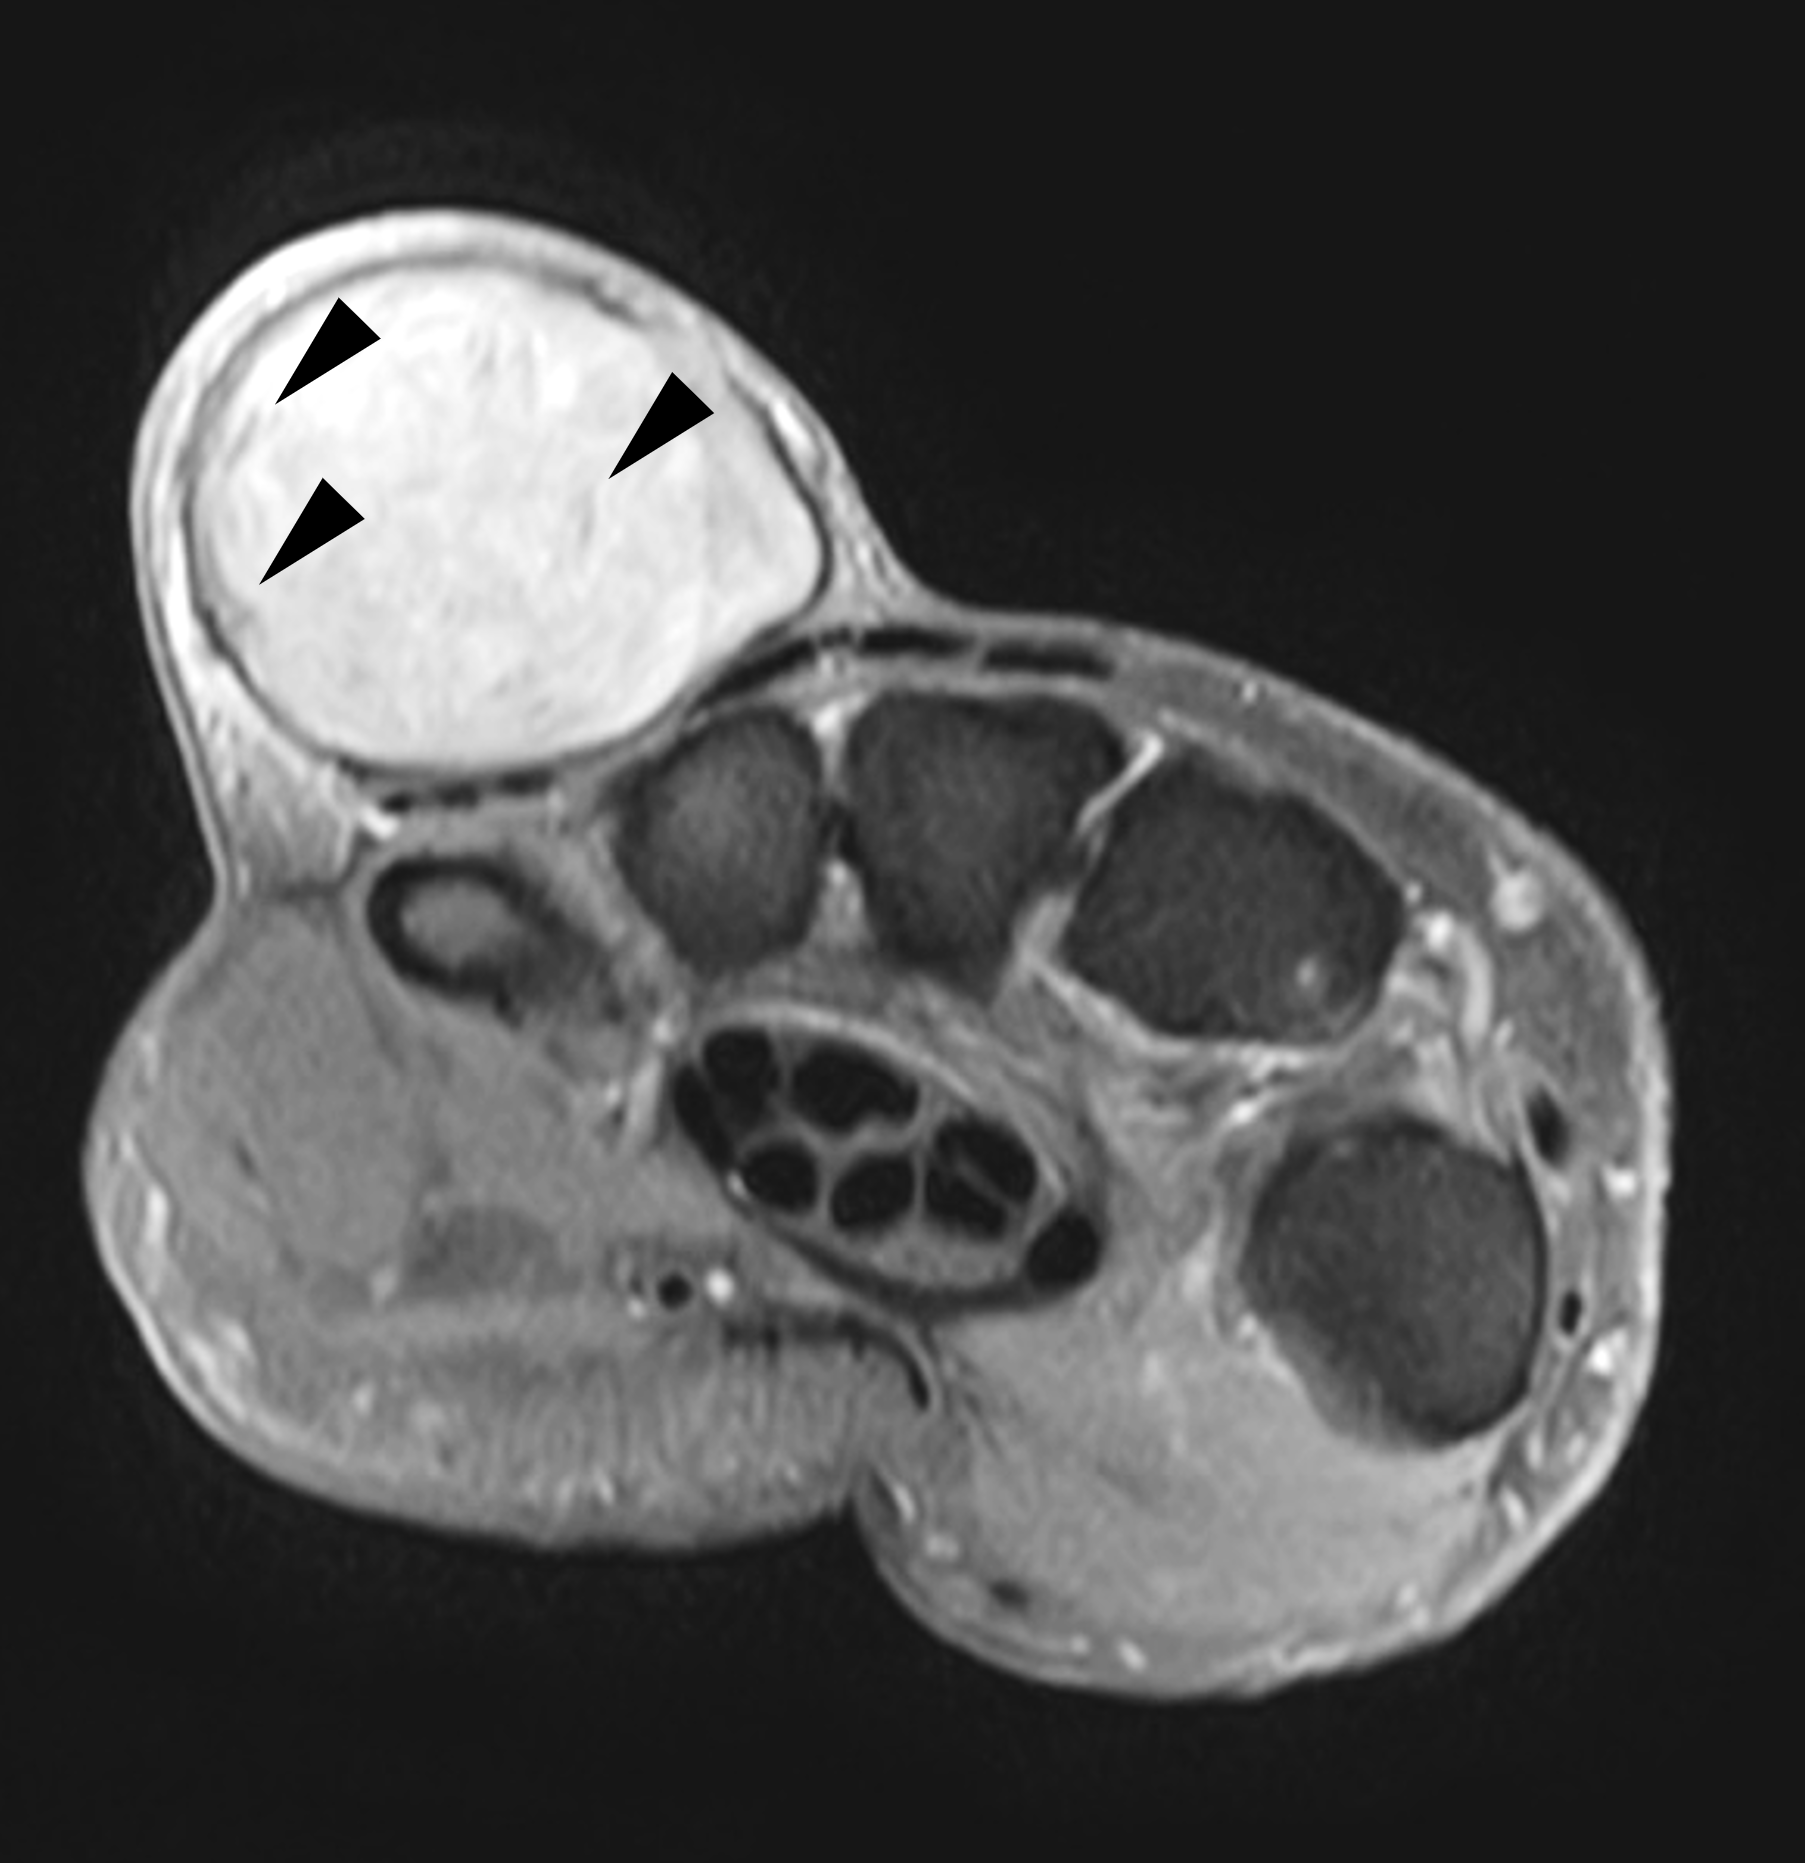


Figure 2: (2A) Axial T1-weighted image shows a large, circumscribed subcutaneous mass just under the skin in the dorsoulnar hand, slightly hyperintense compared to skeletal muscle, with a thin low signal-intensity capsule (arrows). (2B) Axial fat-suppressed, proton-density-weighted image shows internal heterogenous hyperintensity with low signal intensity structures (arrowheads). (2C) Sagittal fat-suppressed, T2-weighted image demonstrates multiple low signal intensity structures within the mass (arrowheads). A thin hypointense capsule is present. (2D) Coronal fat-suppressed, T1-weighted image acquired following intravenous contrast administration shows no internal enhancement (asterisk). A thin enhancing capsule is present (arrows).
Diagnosis
Epidermoid inclusion cyst.
Introduction
Histologically, epidermoid inclusion cysts are lined with stratified squamous epithelium and filled with keratin debris shed from the squamous epithelium.1 These pathologic features produce a characteristic appearance on MRI. They can develop by several mechanisms – remnant ectodermal tissues misplaced during embryogenesis, occlusion of the pilosebaceous unit causing a cystic reaction, or traumatic or surgical implantation of epithelial elements into the dermis or subcutaneous tissues.2,3 Most cases are sporadic. Several synonyms for epidermoid inclusion cyst exist, including epidermal cyst, infundibular cyst, inclusion cyst, and keratin cyst. The cysts do not originate from a sebaceous gland and they contain keratin, not sebum; therefore, the term “sebaceous cyst” is inaccurate and should not be used to describe an epidermoid cyst.
An epidermoid inclusion cyst typically presents as a nodule or mass close to the skin surface, often with a visible central punctum, and diagnosis is often made clinically. They can occur anywhere but most commonly involve the scalp, face, neck, trunk, and back; fewer than 10% are located in the extremities.4 Lesions may remain stable or progressively enlarge. Growth is secondary to accumulation of epithelial and keratinous debris. Most cysts range from 1 to 4 cm and rarely exceed 5 cm in diameter.5
Epidermoid inclusion cysts are benign and generally do not require treatment. They are usually painless unless they rupture or become infected. When inflammation is present, it typically results from cyst rupture with leakage of cyst contents into the surrounding cutaneous and subcutaneous tissues. Infected cysts – usually from normal skin flora organisms – may require incision and drainage. Growing lesions may require total excision of the cyst with the walls intact to prevent recurrence. If inflamed, the walls of the cyst become friable and dissection planes are difficult to appreciate, increasing the rate of cyst recurrence.6 Malignant degeneration of epidermoid inclusion cysts is very rare with basal cell carcinoma or squamous cell carcinoma reported in 0.011 to 0.045% of cases.7,8
MRI Findings
On MRI, epidermoid inclusion cysts are superficial subcutaneous lesions, often abutting the dermis. They are most commonly circumscribed, round or ovoid in appearance, with a thin peripheral hypointense rim.9 The internal contents are usually isointense to slightly hyperintense compared to skeletal muscle on T1-weighted images, reflecting the internal keratin content, and intermediate-to-high signal on fluid-sensitive sequences.10,11 Internal low-signal components on fluid-sensitive images are visible in 43-58% of cases (Figure 3), and can be used to differentiate epidermoid cysts from other simple fluid-filled cysts such as ganglia.10,12 Importantly, post-contrast images should show no internal enhancement. The lack of enhancement helps differentiate epidermoid inclusion cysts from solid lesions, such as neurogenic tumors, nodular fasciitis, myxoid tumors, and dermatofibrosarcoma protuberans, all of which may mimic cystic lesions on fluid-sensitive sequences.13,14,15,16 A thin peripheral rim of enhancement may be present, especially if the cyst is inflamed (Figure 4).

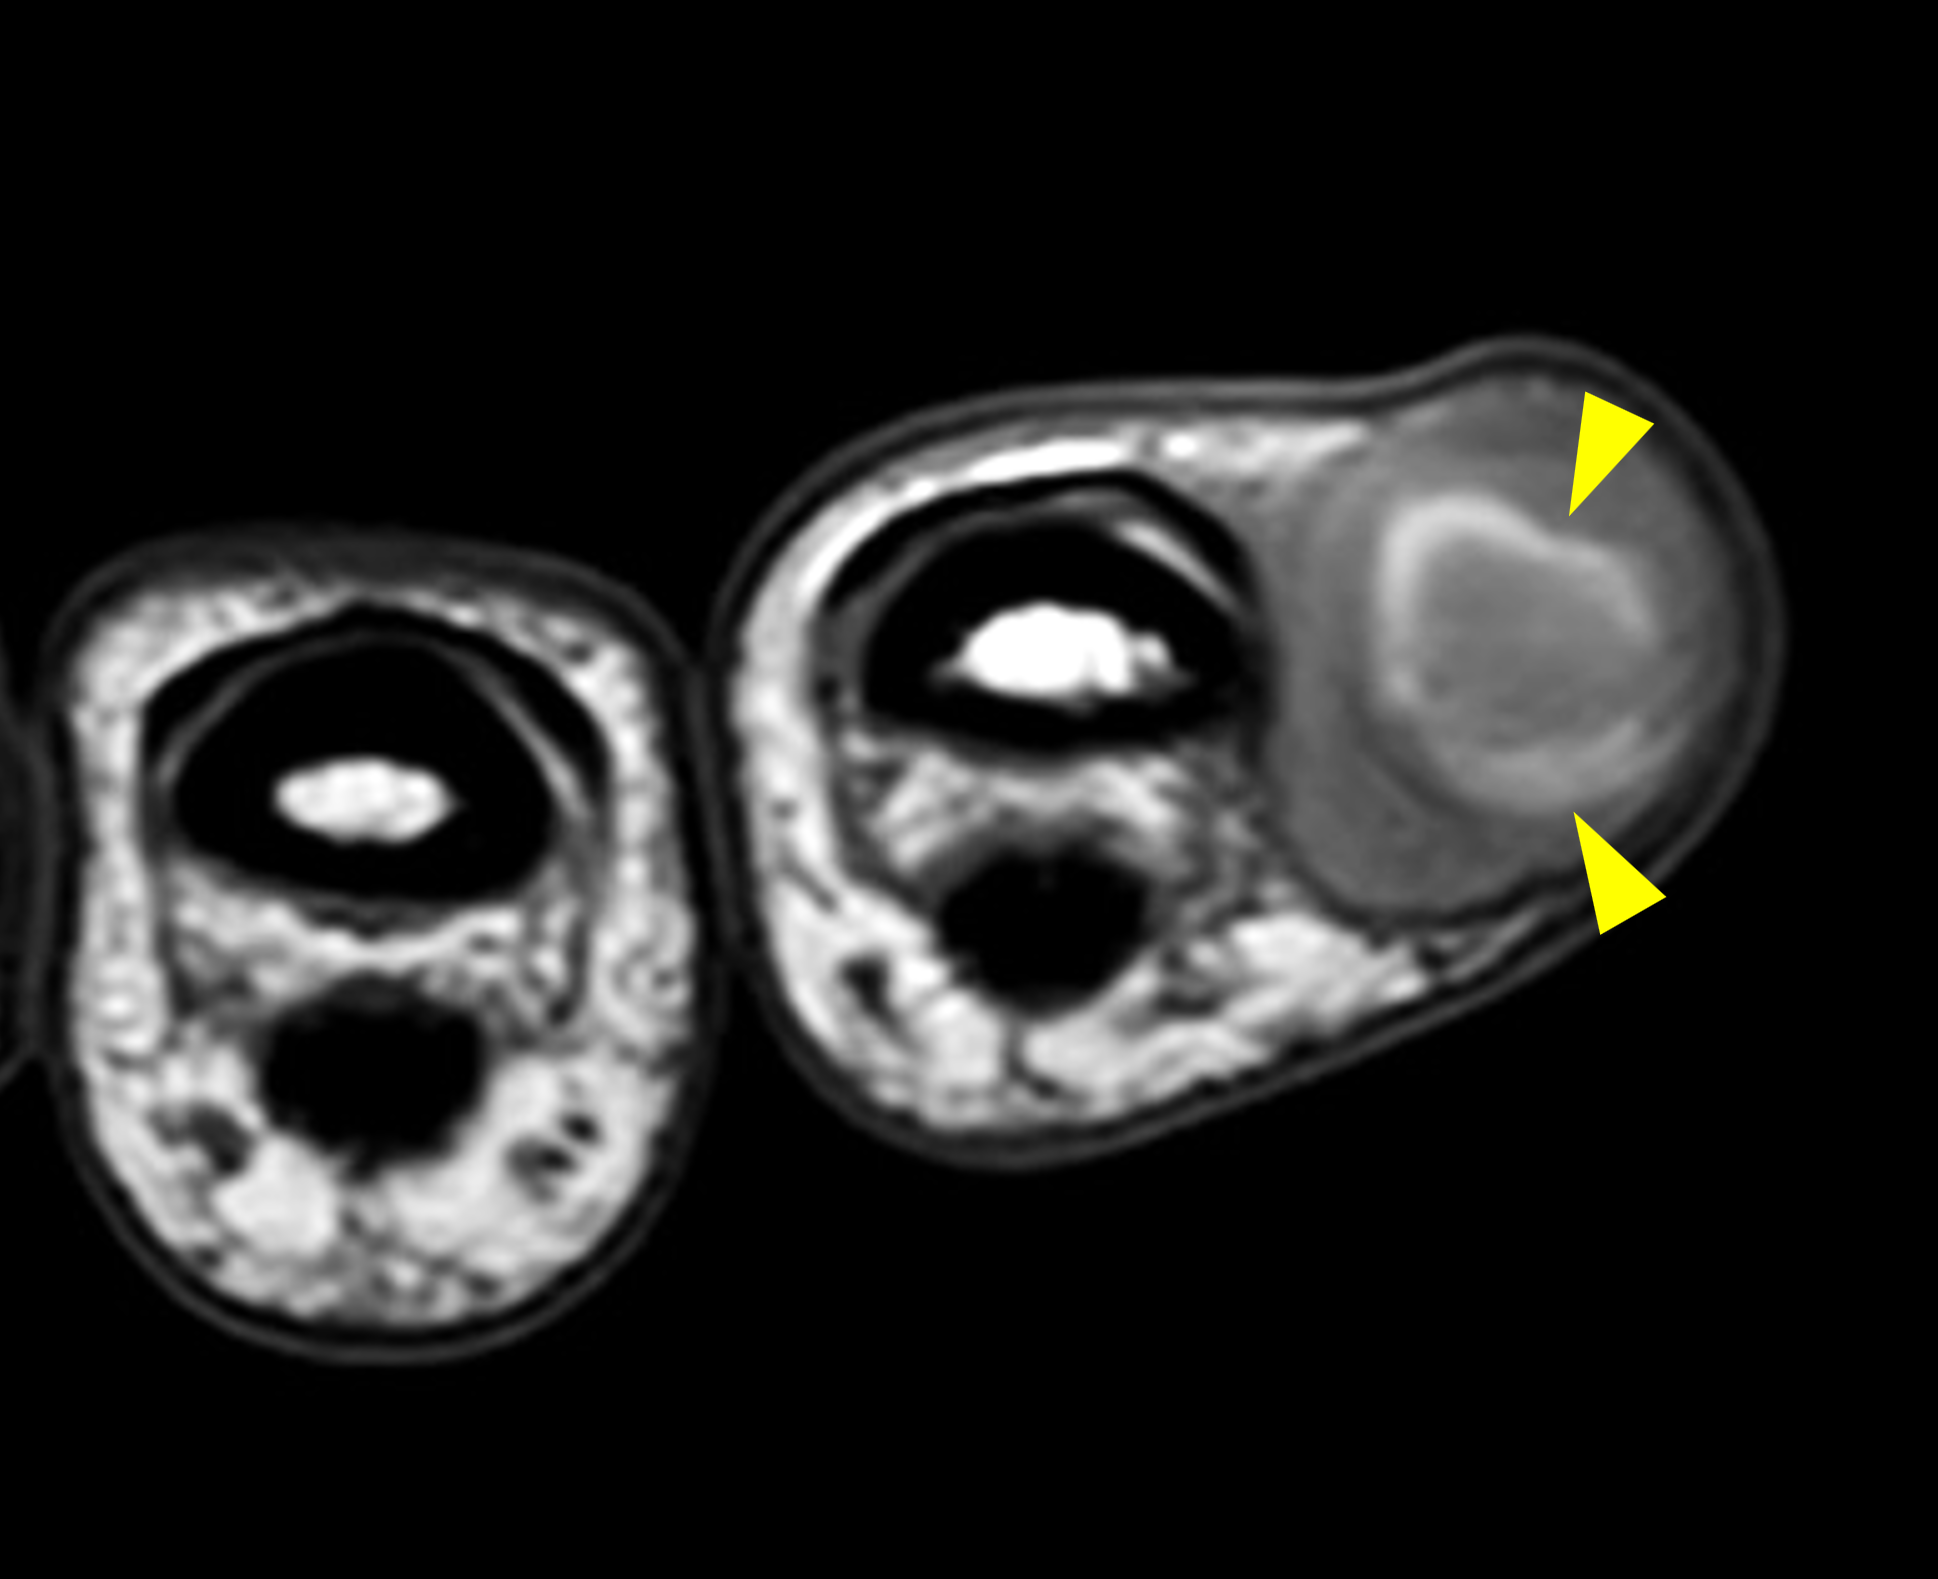
Figure 3: Epidermoid inclusion cyst in the index finger. (3A) Coronal fat-suppressed, T2-weighted image demonstrates a circumscribed hyperintense subcutaneous cyst abutting the dermis with internal hypointense, mass-like (yellow arrowhead) and curvilinear (red arrowheads) debris reflecting keratin products. (3B) Axial T1-weighted image demonstrates internal curvilinear hyperintense material (arrowheads) also representing keratin (arrowheads). A thin capsule surrounds the lesion.


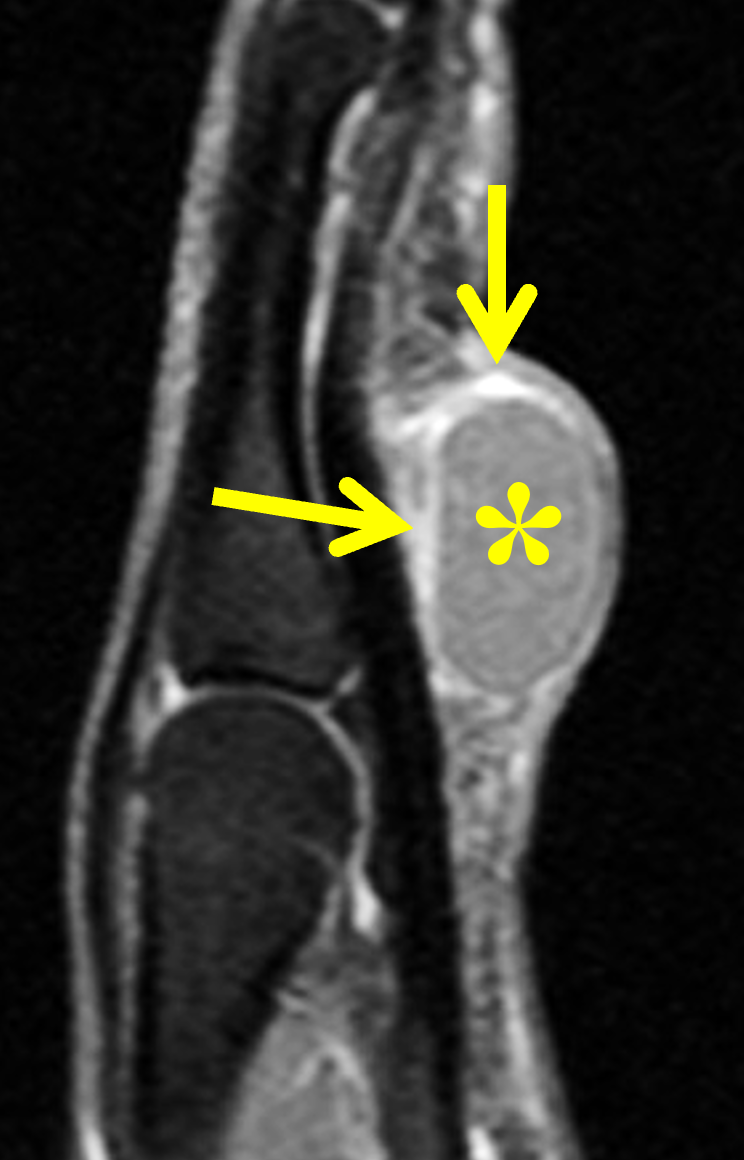
Figure 4: Subcutaneous epidermoid inclusion cyst in the hand, palmar to the flexor tendons of the ring finger. (4A) Axial T1-weighted image shows a circumscribed mass that is approximately isointense compared to skeletal muscle with thin internal septa. (4B) Axial STIR image demonstrates a complex, heterogenous high signal intensity structure with a linear hypointense focus of debris/keratin (arrowhead). Differential diagnosis would include a ganglion cyst; however, while ganglion cysts can contain septa, their contents are typically more homogenous and without internal debris. (4C) Sagittal fat-suppressed, T1-weighted image obtained following intravenous contrast administration confirms the cystic nature of the lesion with no internal enhancement (asterisk), a thin peripheral enhancing capsule (arrows), and mild surrounding inflammation. The lesion was excised and pathology confirmed an epidermoid inclusion cyst.
Ruptured epidermoid inclusion cysts often demonstrate thicker, irregular rim enhancement and adjacent soft-tissue enhancement (Figures 5 and 6) similar to other inflammatory lesions, such as abscesses, ruptured ganglion cysts, or bursitis. Although not commonly performed, diffusion-weight imaging will show diffusion restriction, reflecting dense keratinaceous debris.
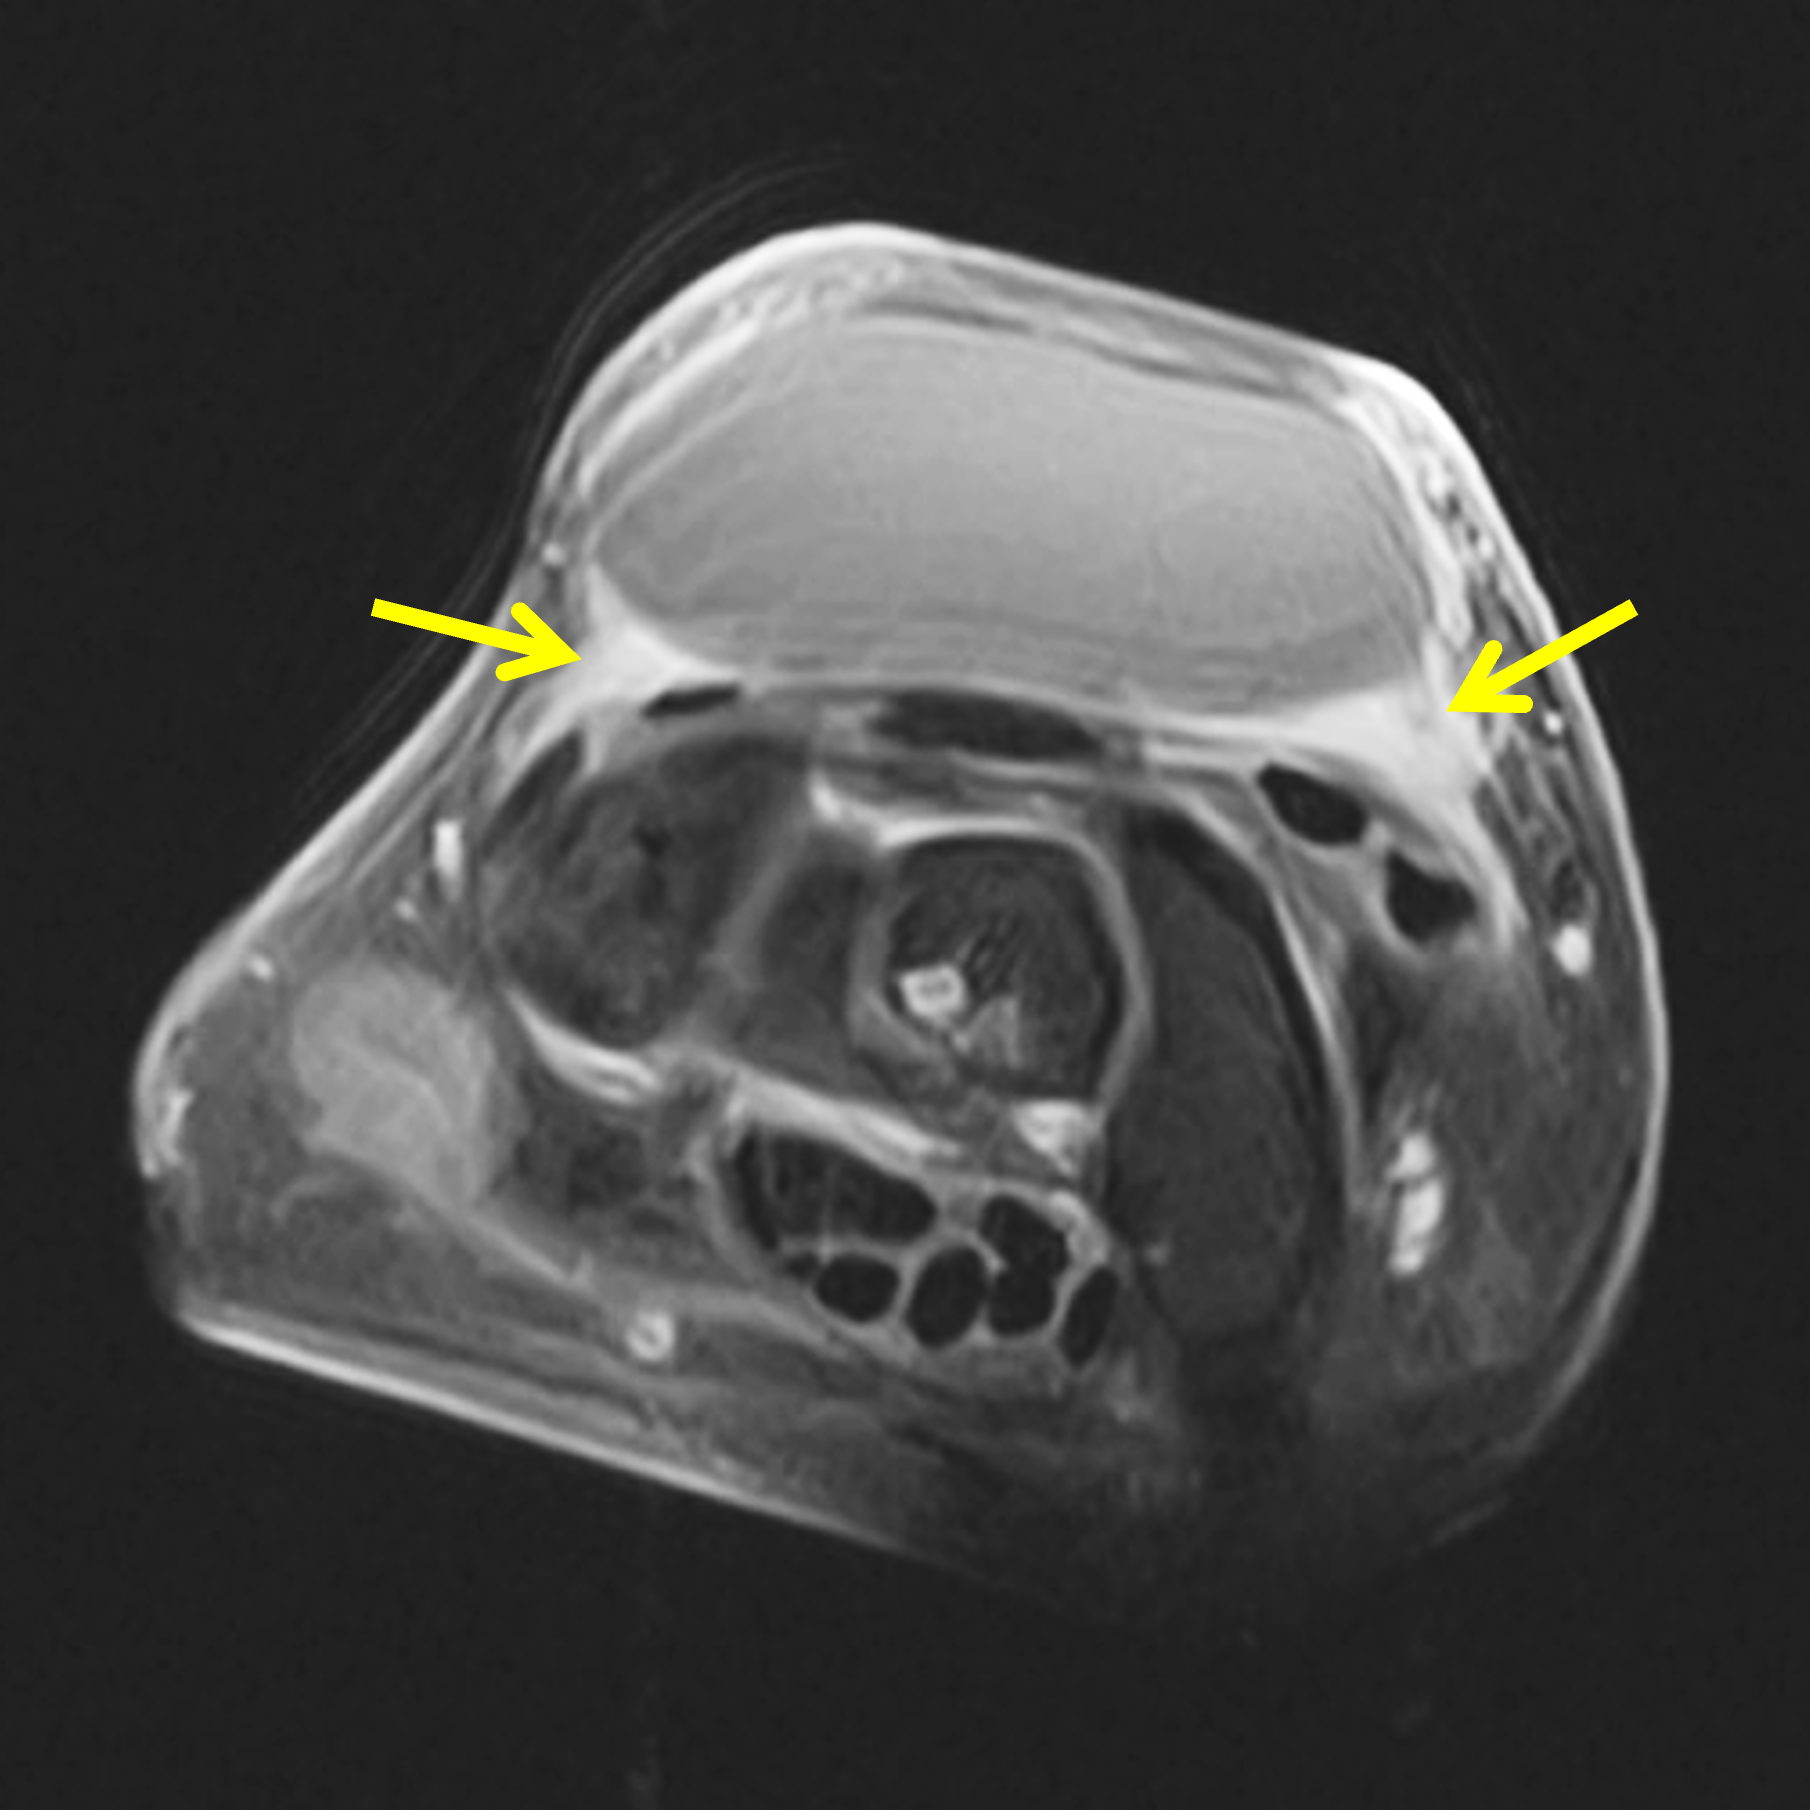
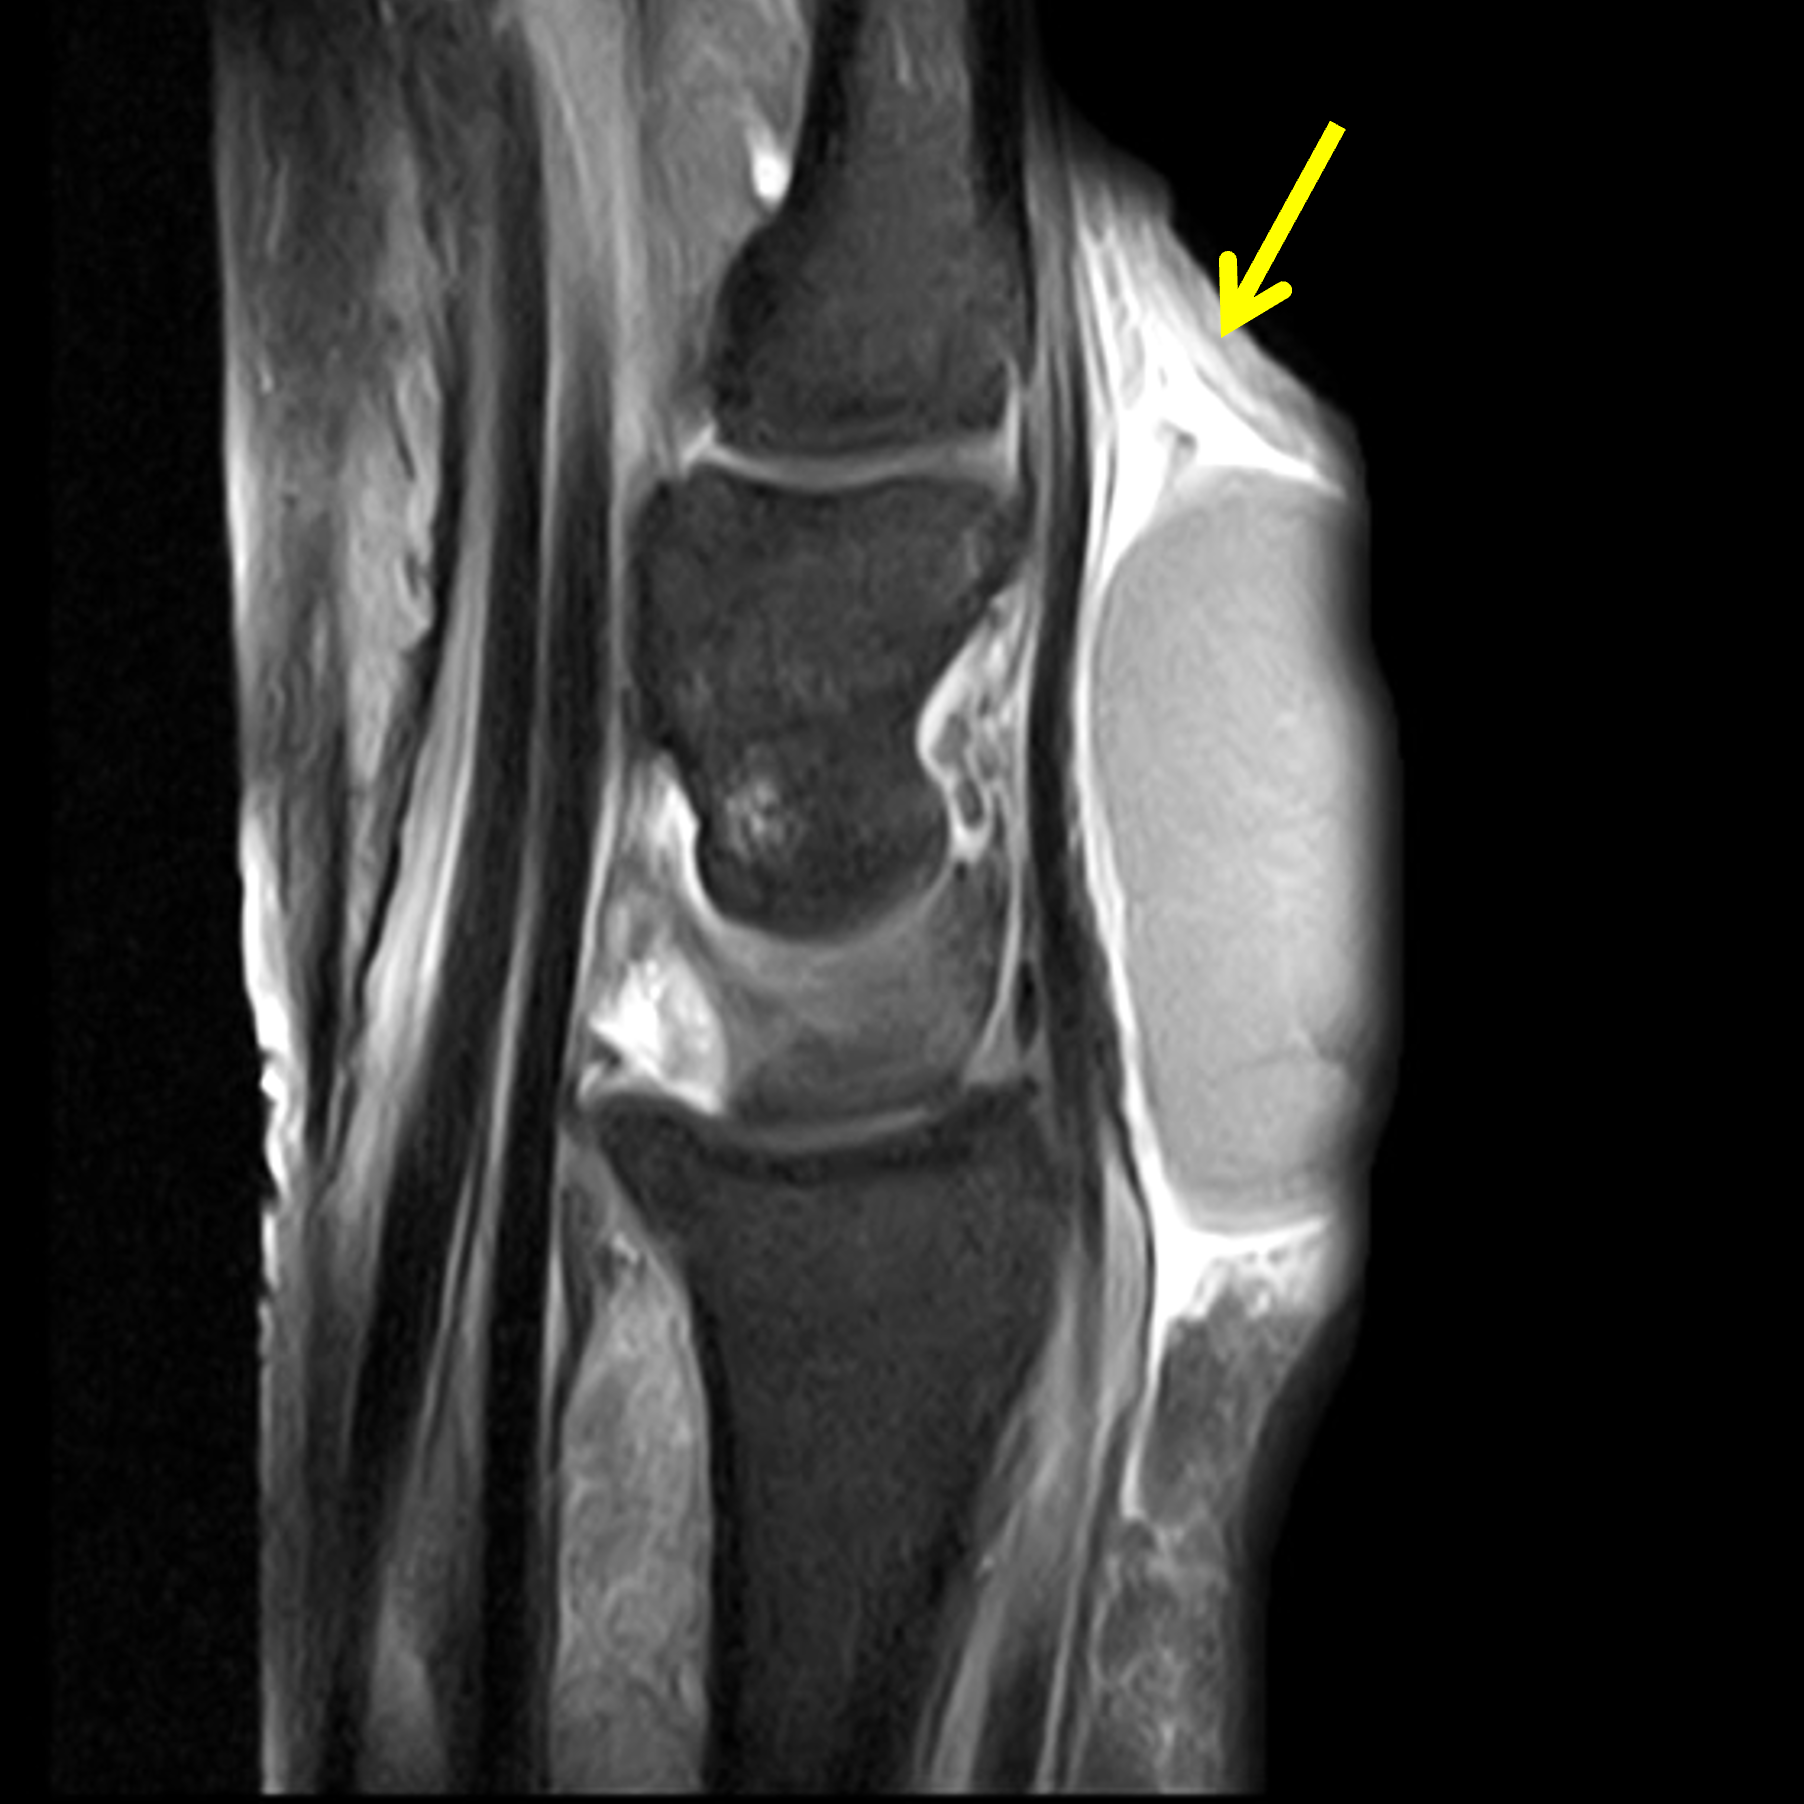
Figure 5: Inflamed, partly-ruptured epidermoid inclusion cyst in the dorsum of the wrist. (5A) Axial fat-suppressed, T1-weighted image acquired following intravenous contrast shows relatively thick peripheral enhancement along the deep margins of the cyst (arrows). (5B) Sagittal fat-suppressed, T1-weighted image acquired following intravenous contrast shows ill-defined diffuse soft tissue enhancement distal to the cyst (arrow) representing surrounding inflammation.
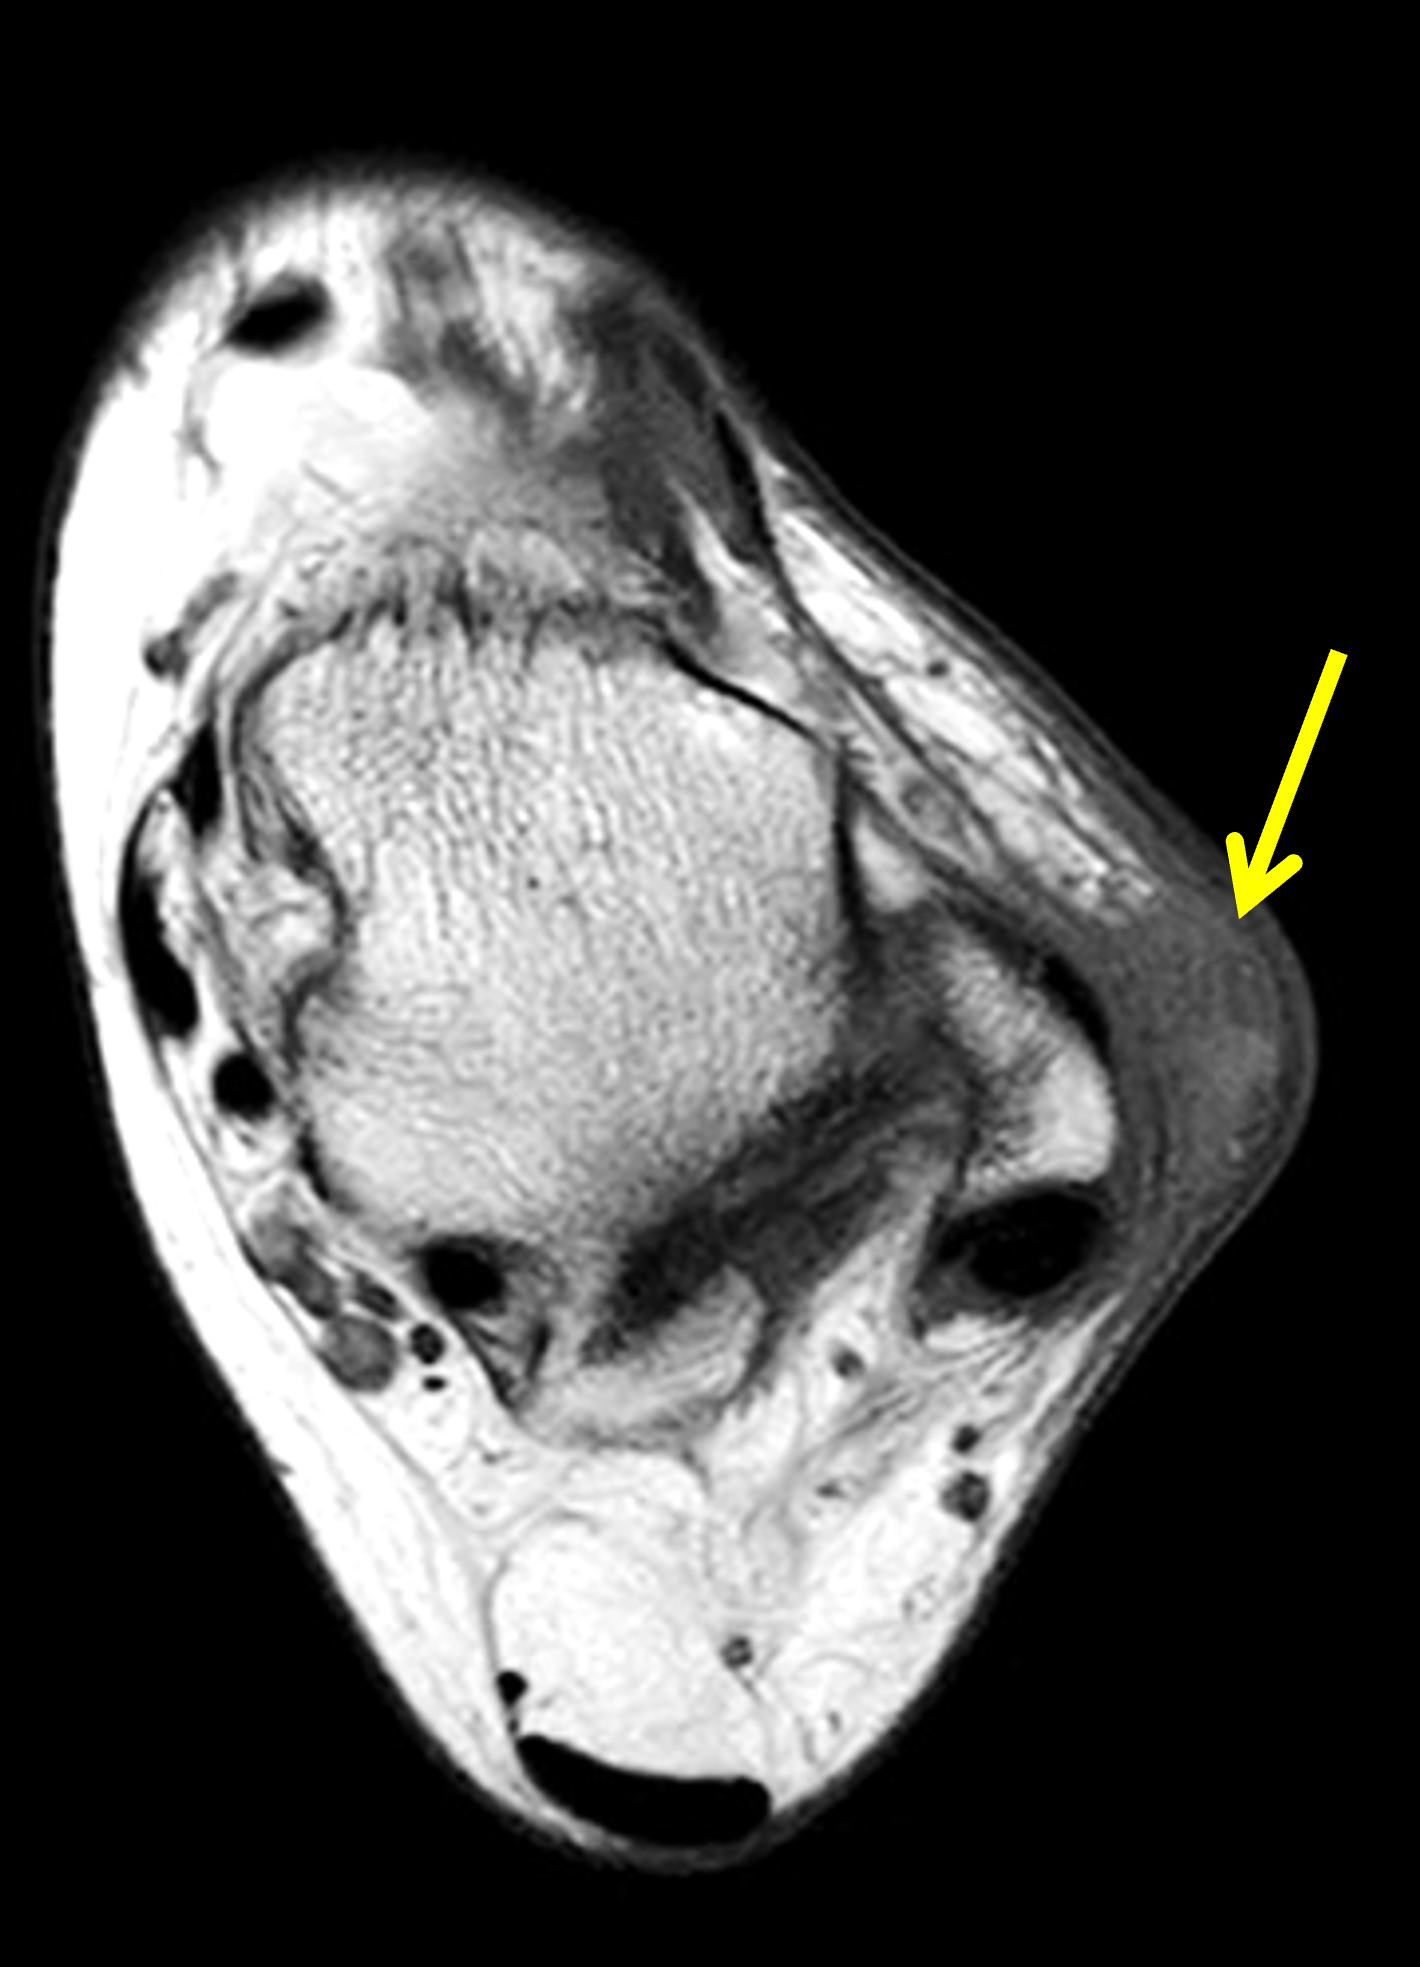

Figure 6: Ruptured epidermoid inclusion cyst in the lateral ankle. (6A) Axial T1-weighted image shows an ill-defined, subcutaneous mass (arrow) near the skin surface lateral to the distal fibula. (6B) Coronal fat-suppressed, proton density-weighted image shows ill-defined subcutaneous edema surrounding the mass (arrow). Excision was performed and demonstrated a ruptured epidermoid inclusion cyst.
Bone pressure erosion or expansion is not uncommon with epidermoid inclusion cysts in the digits (Figure 7).Recognition of the typical location, morphology, and MR features as well as a history indicating a growing, painless mass, allows confident diagnosis in most cases, preventing the need for further work-up or biopsy.
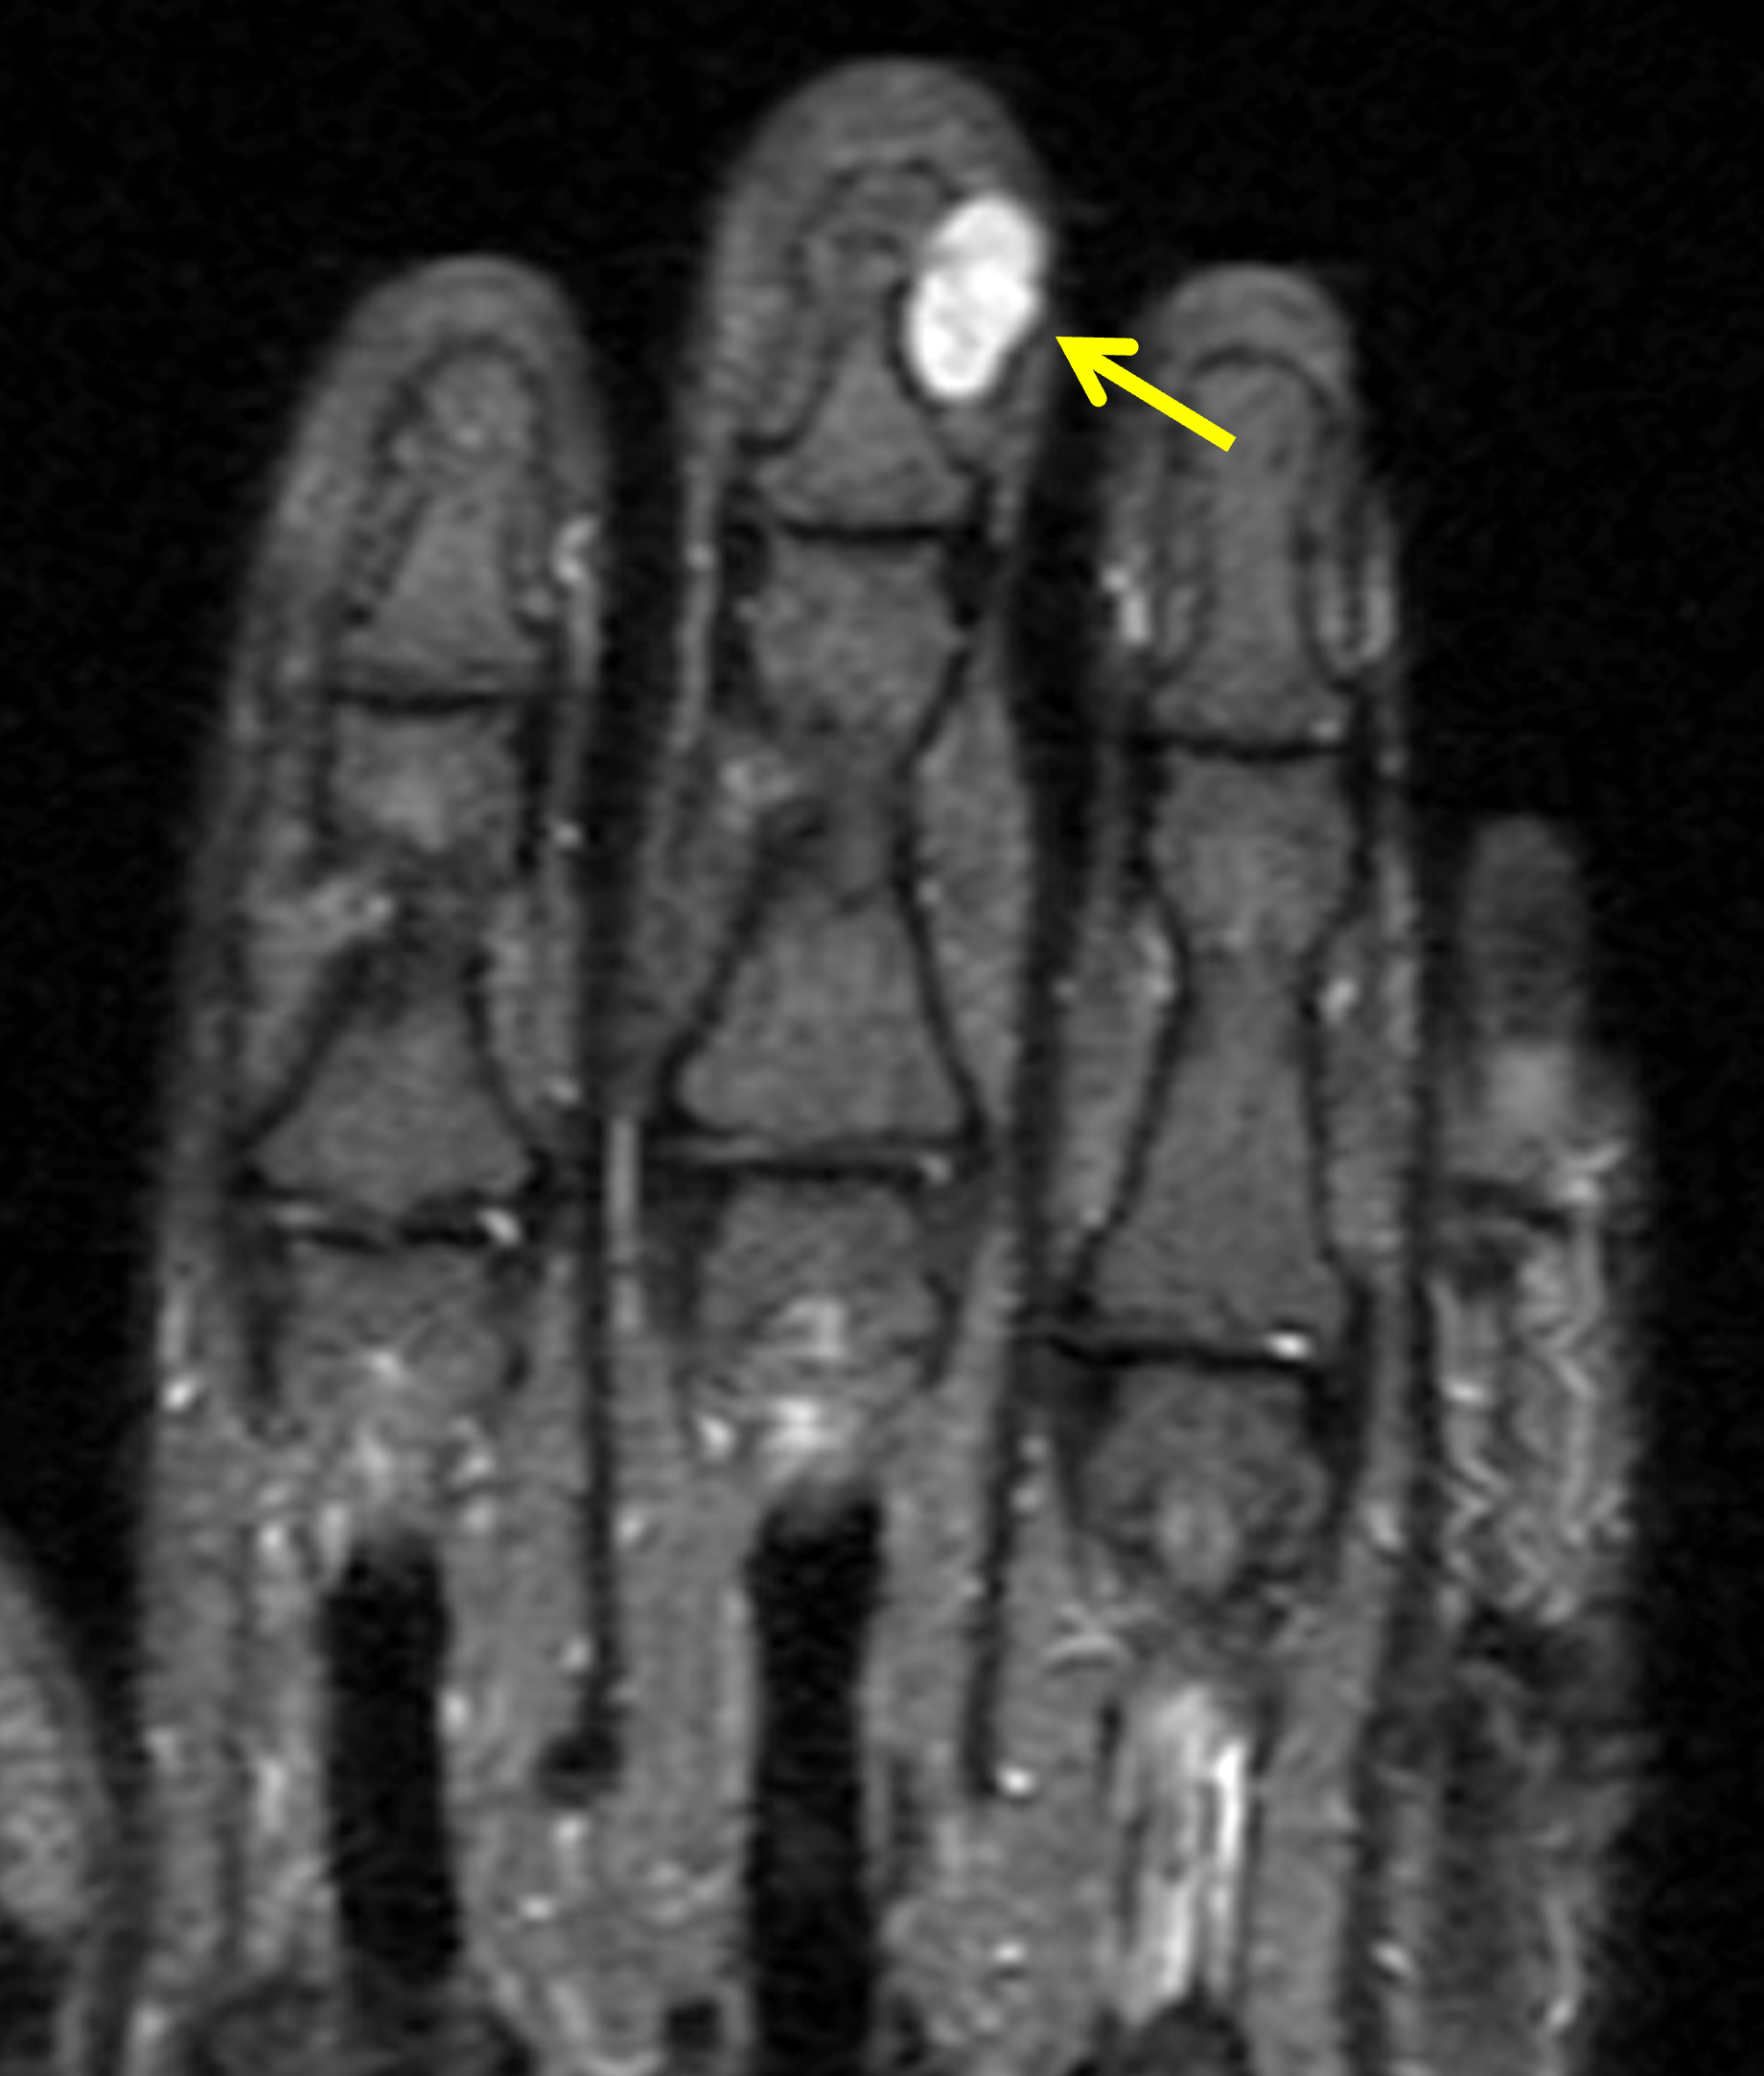
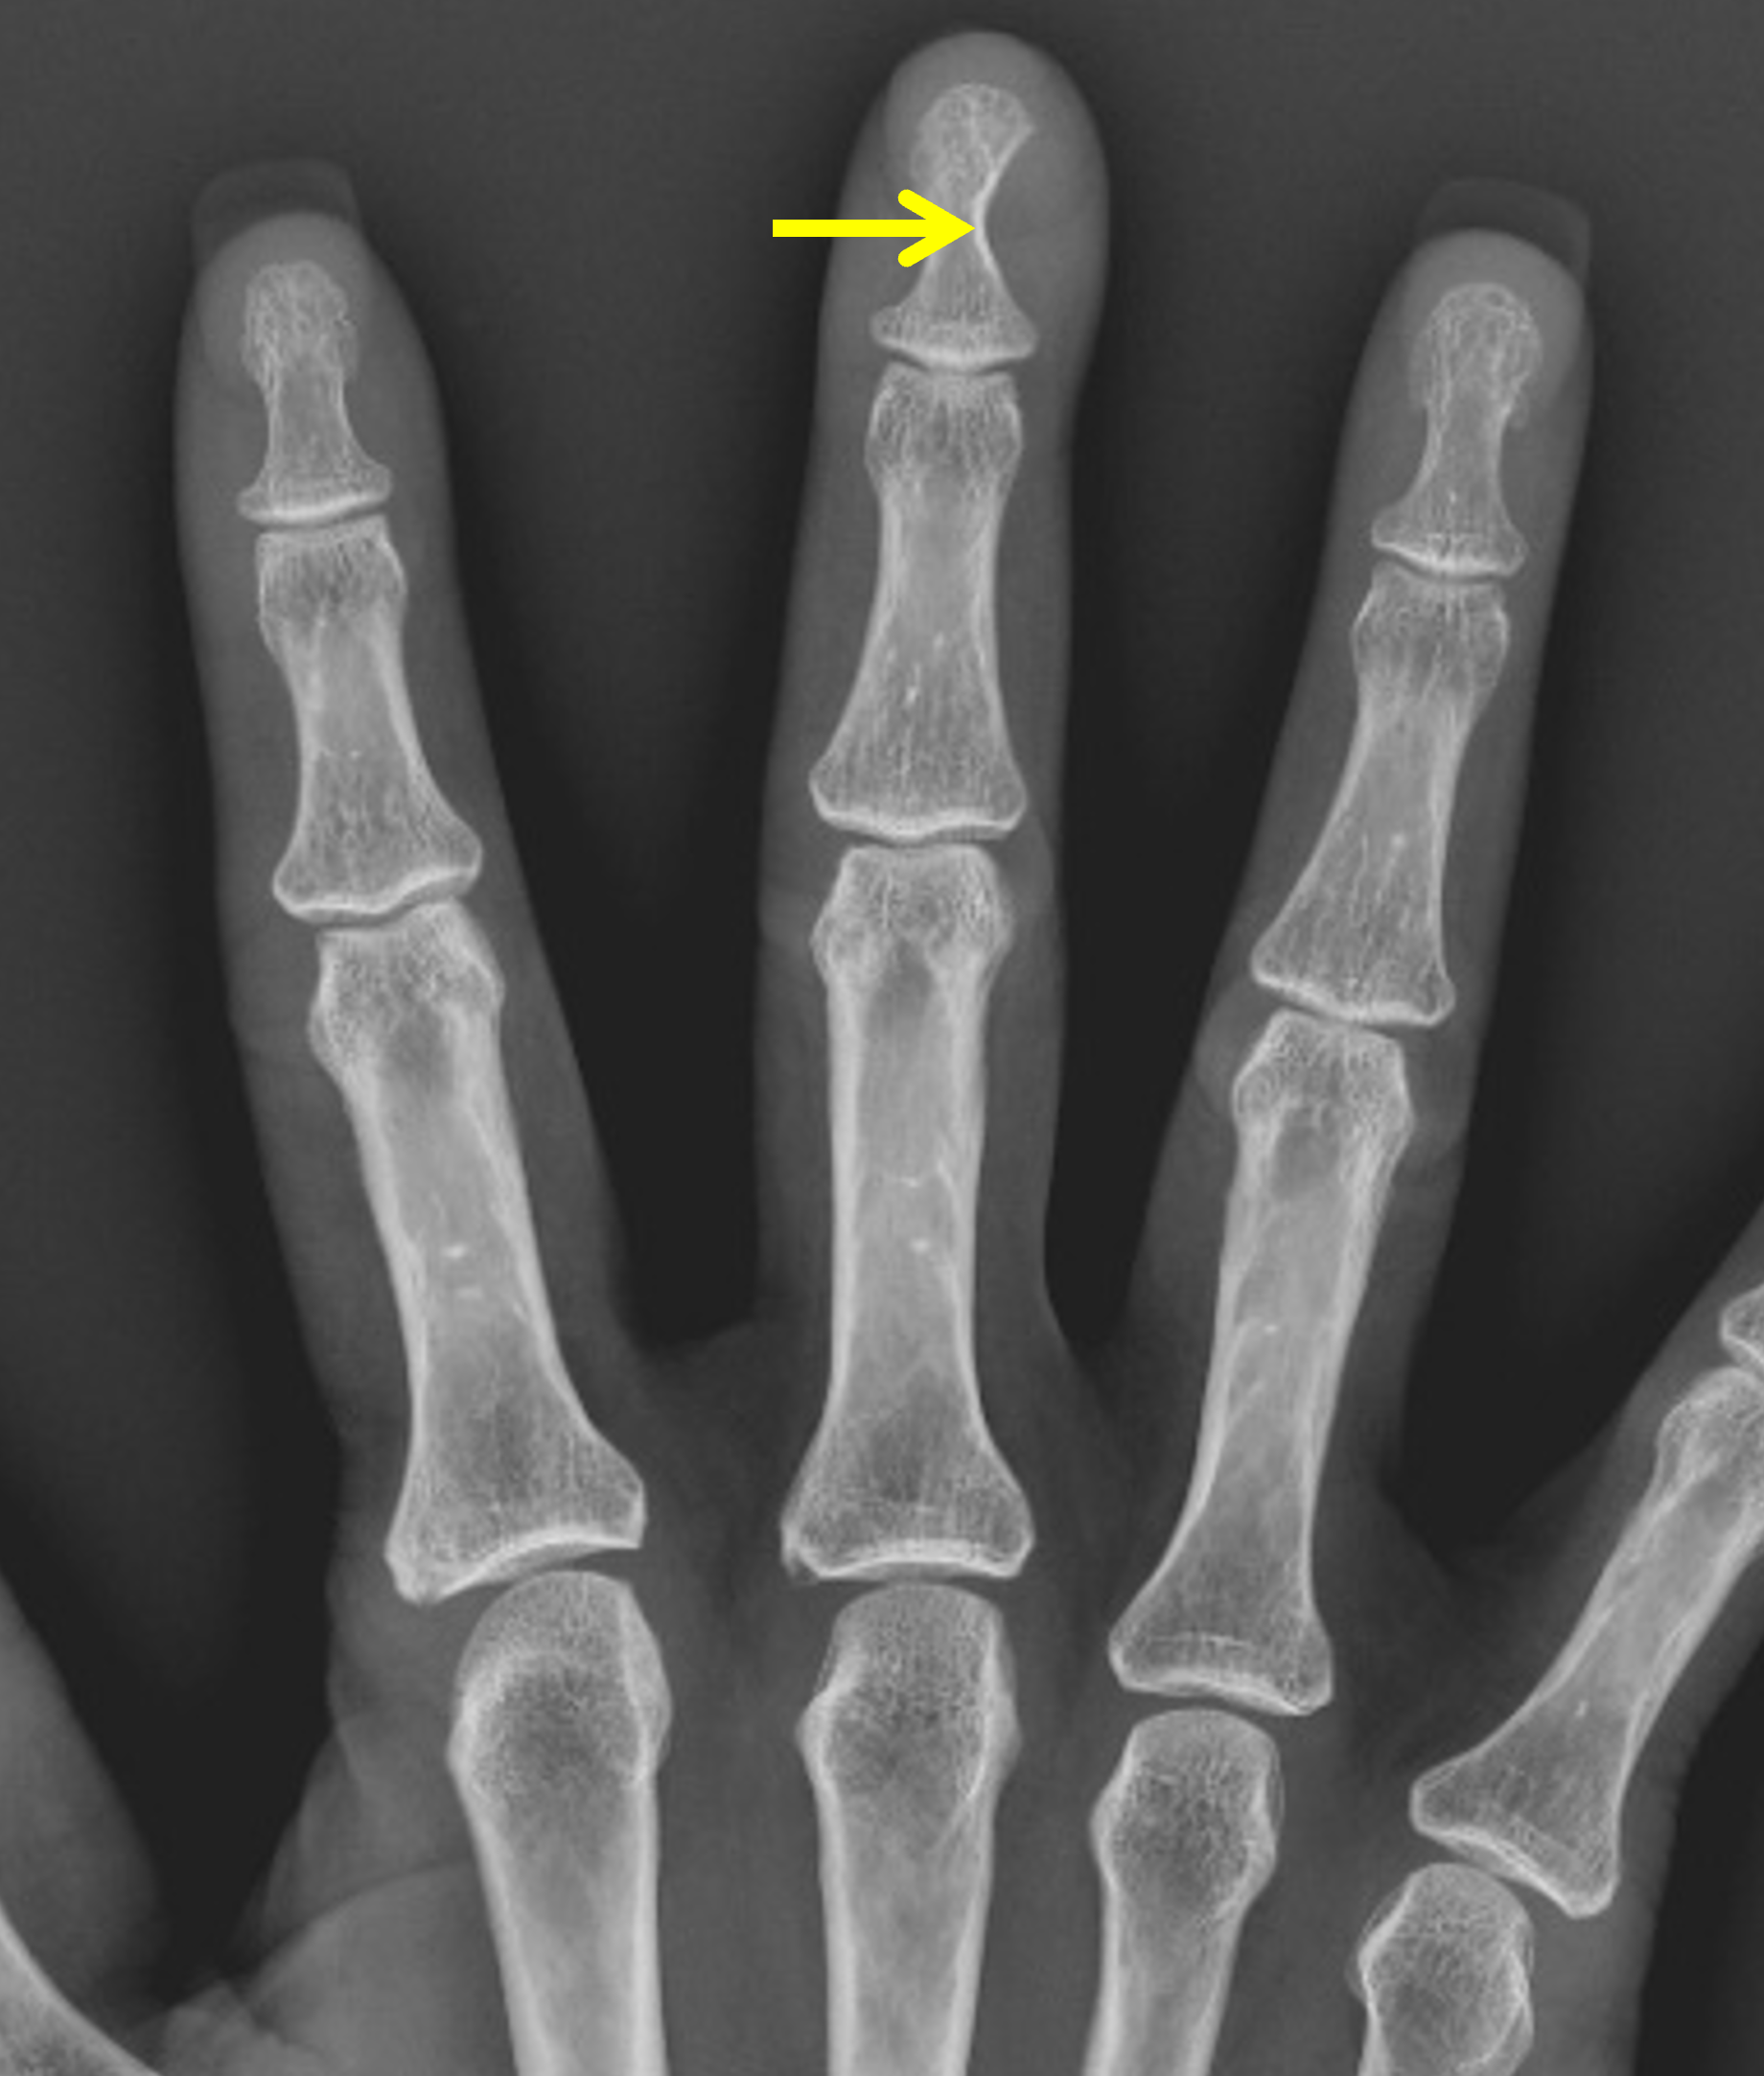
Figure 7: Epidermoid inclusion cyst with bone remodeling in the long finger. (7A) Coronal STIR image demonstrates a circumscribed, mildly heterogeneous hyperintense lesion extending from the skin surface to the ulnar cortex of the distal phalanx (arrow). Note the normal signal intensity of the bone marrow. (7B) PA radiograph shows a soft tissue mass along the ulnar aspect of the finger with chronic-appearing pressure erosion of the underlying bone (arrow).
As noted above, malignant degeneration of epidermoid inclusion cysts is extremely rare. MRI findings may be similar between squamous cell carcinomas arising from epidermoid inclusion cysts and ruptured epidermoid cysts including septal and thick, ill-defined rim enhancement.
Differential Diagnosis
A palpable abnormality is a common cause for patient concern and a physician visit. Although more than 99% of all soft-tissue lesions are benign, those that undergo MRI evaluation have a higher likelihood of malignancy because they have reached the point of concern to warrant further imaging by the ordering physician.17 The differential diagnosis for a subcutaneous mass is broad with both non-neoplastic and neoplastic causes. Among all soft-tissue neoplasms, sarcomas remain relatively rare, representing less than 1% of all malignancies.18 Cross-sectional imaging, particularly MRI, plays an important role in the work-up and decision making for palpable masses. Many subcutaneous lesions, including many epidermoid inclusion cysts, have a pathognomonic MRI appearance allowing diagnosis in a cost-effective method without the need for biopsy or additional work-up.19 Other features may be nonspecific and require further evaluation with either follow-up imaging, additional testing, or biopsy. The following discussion will focus on superficial lesions that appear similar to epidermoid inclusion cysts, emphasizing non-malignant etiologies.
If a mass is present, the first step in evaluation is to determine if the lesion is cystic or solid. Cystic lesions should be hyperintense on fluid-sensitive sequences, but may not be isointense to water, depending on the protein concentration of the contents. The absence of postcontrast internal enhancement with or without a thin, peripheral enhancing rim supports the diagnosis of a cystic or other fluid-filled structure. If contrast-enhanced images are not obtained, care must be taken to ensure that a T2-hyperintense lesion is truly fluid-filled and not a myxoid or hypercellular tumor with a high water-content. If the lesion is in an unusual location or demonstrates any heterogeneity, nodularity, or thick septa, further evaluation with additional imaging or histological sampling may be required. The differential diagnosis of non-enhancing, fluid-filled subcutaneous lesions includes epidermoid inclusion cysts, hematomas, seromas, ganglion/synovial cysts, distended bursae, Morel-Lavallee lesions, and abscesses. As previously noted, epidermoid inclusion cysts often contain internal T2-hypointense keratinaceous debris and have a thin peripheral rim. The MR characteristics, superficial location, and clinical history help differentiate epidermoid cysts from other cystic lesions.
Hematomas, which contain blood products, and seromas, which contain serous/proteinaceous fluid, often form secondary to trauma or surgery. Hematomas have highly variable imaging characteristics that depend on the age of blood and type of hemoglobin present, ranging from oxyhemoglobin to deoxyhemoglobin and methemoglobin. Most commonly hematomas are imaged in the early subacute (3 to 7 days) to late subacute (7 to 14-28 days) period. During this time, internal signal is generally T1 hyperintense and T2 hypointense compared to skeletal muscle, representing methemoglobin. As a hematoma ages, a very low signal hemosiderin rim will often appear (Figure 8). T2*-weighted sequences, such as susceptibility-weighted and gradient-echo sequences with a relatively long TE will demonstrate hypointense signal and blooming artifact during the subacute to chronic phases.20 Seromas most typically form after surgery with a thin, dark pseudocapsule, surrounding soft tissue edema, and homogenous contents that are equivalent signal to fluid on all pulse sequences.21 Often a history of trauma or surgery as well as the MR appearance is enough to accurately characterize a palpable abnormality as a hematoma or seroma. Importantly, none of these collections will demonstrate internal enhancement if intravenous contrast is administered.
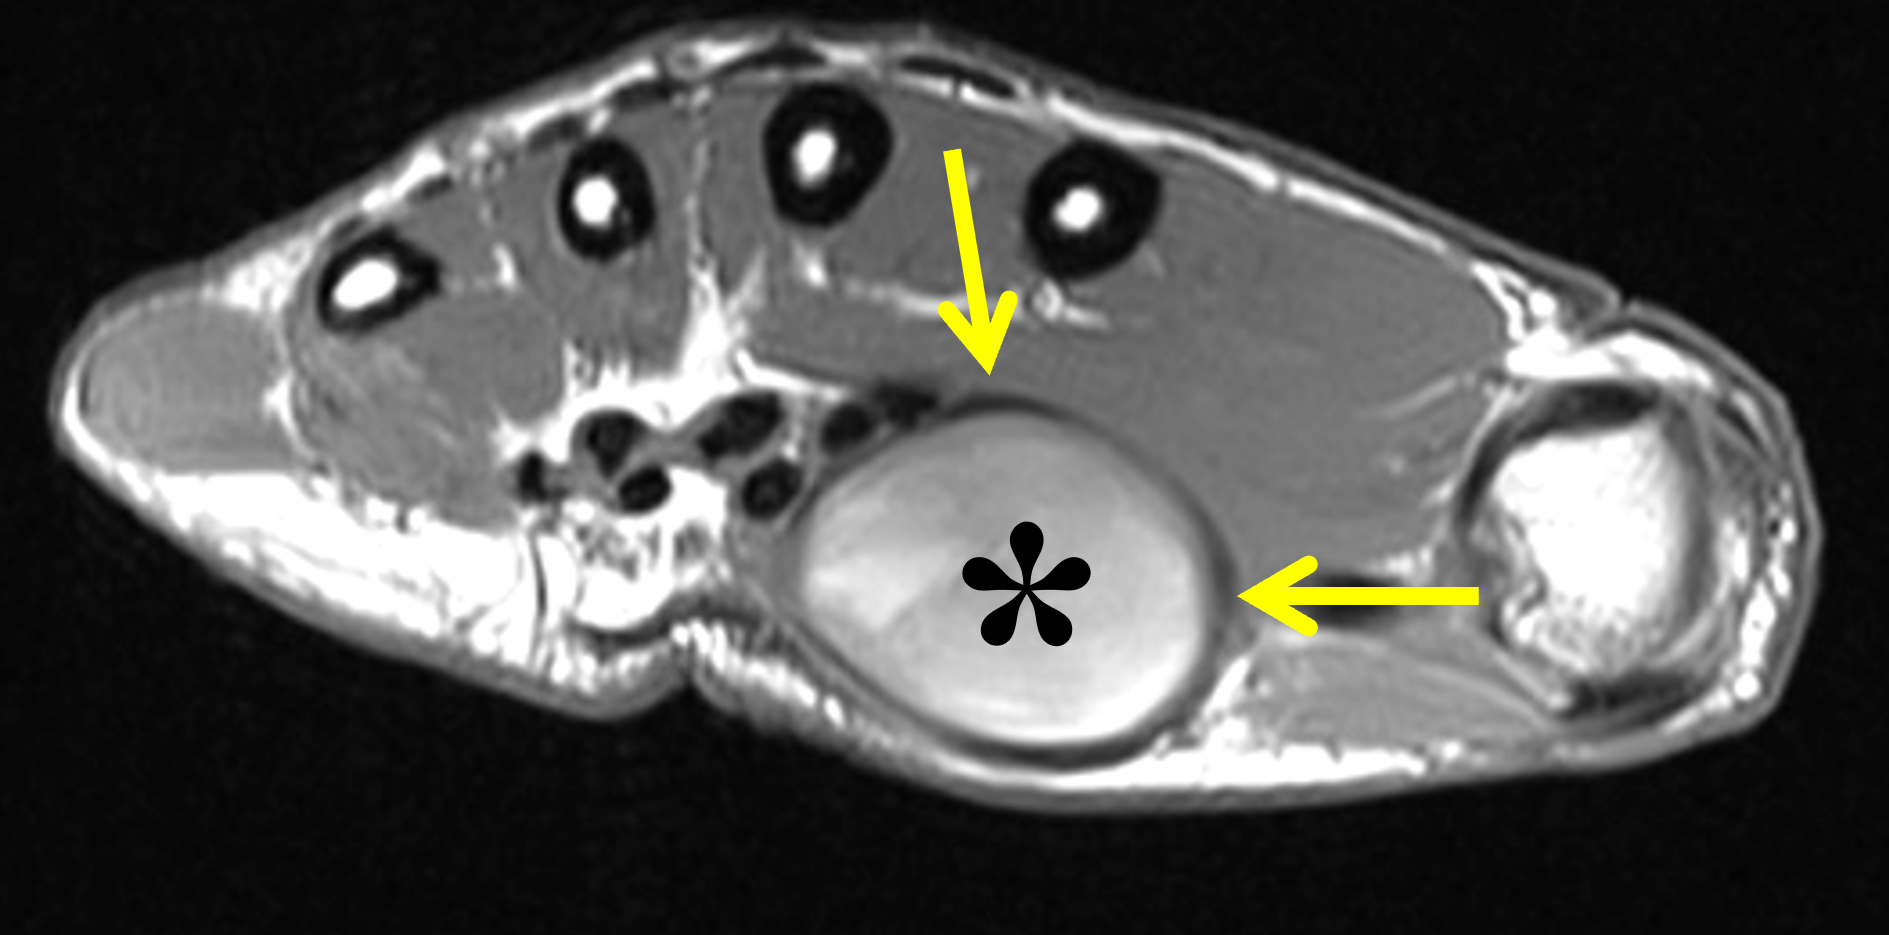
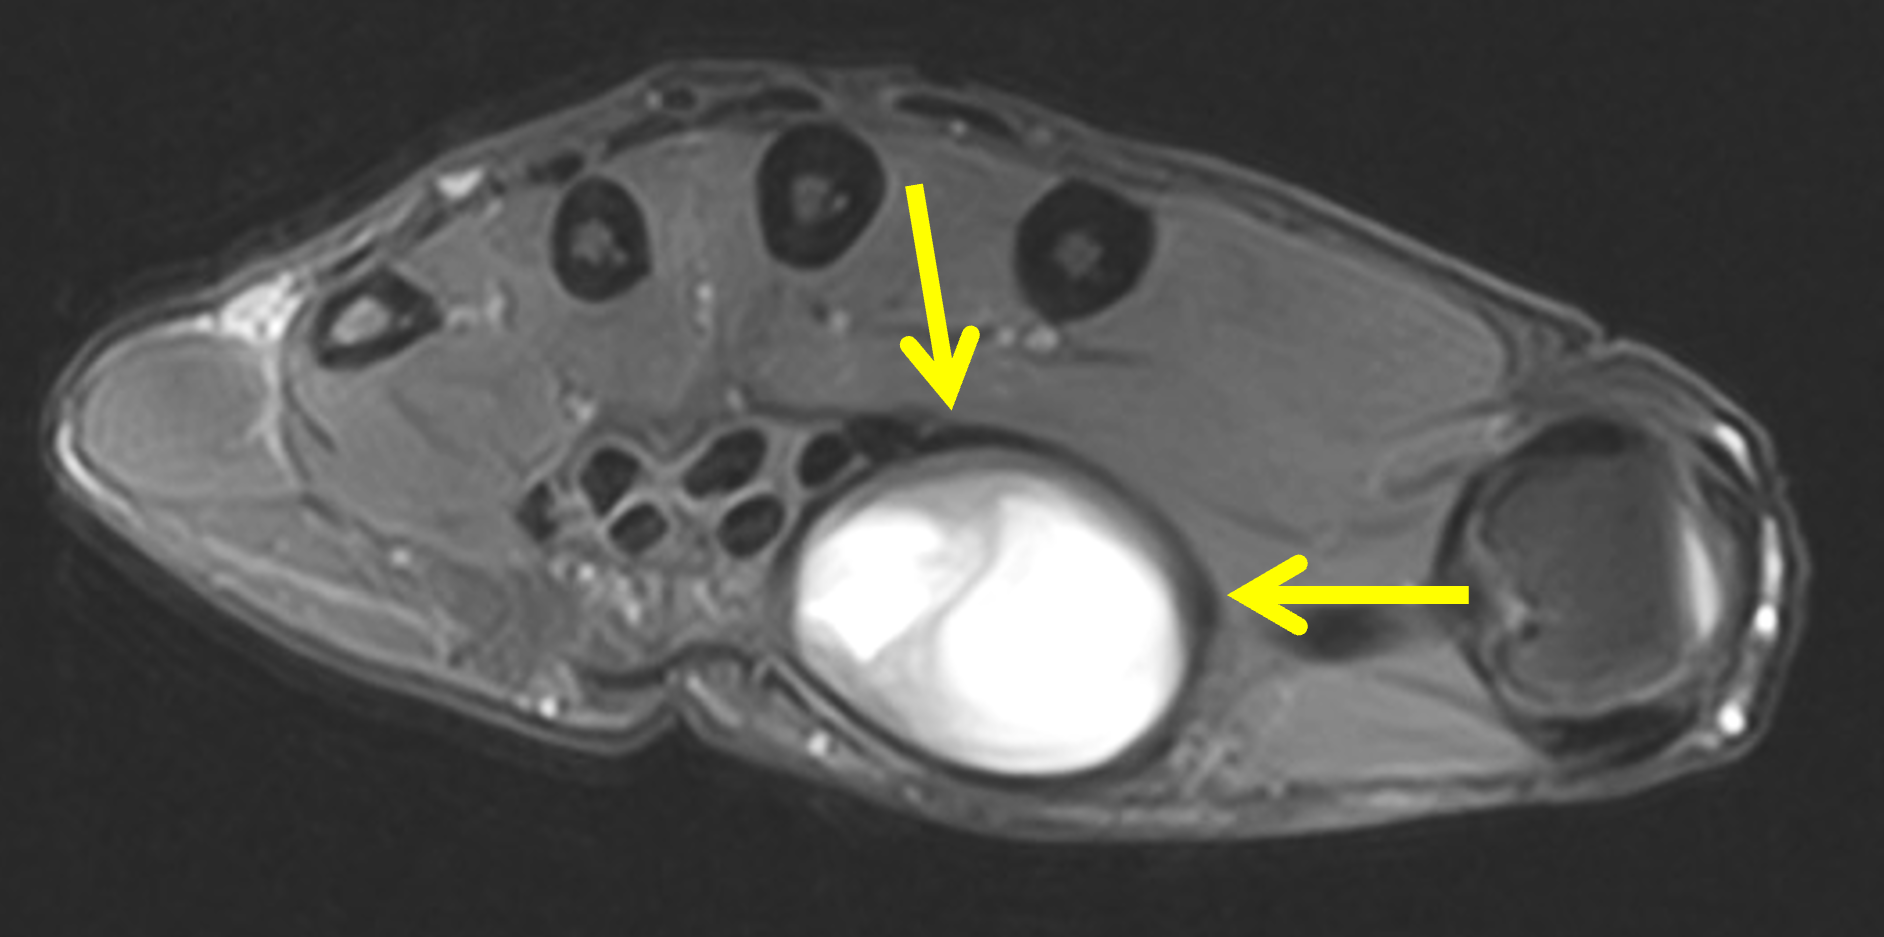
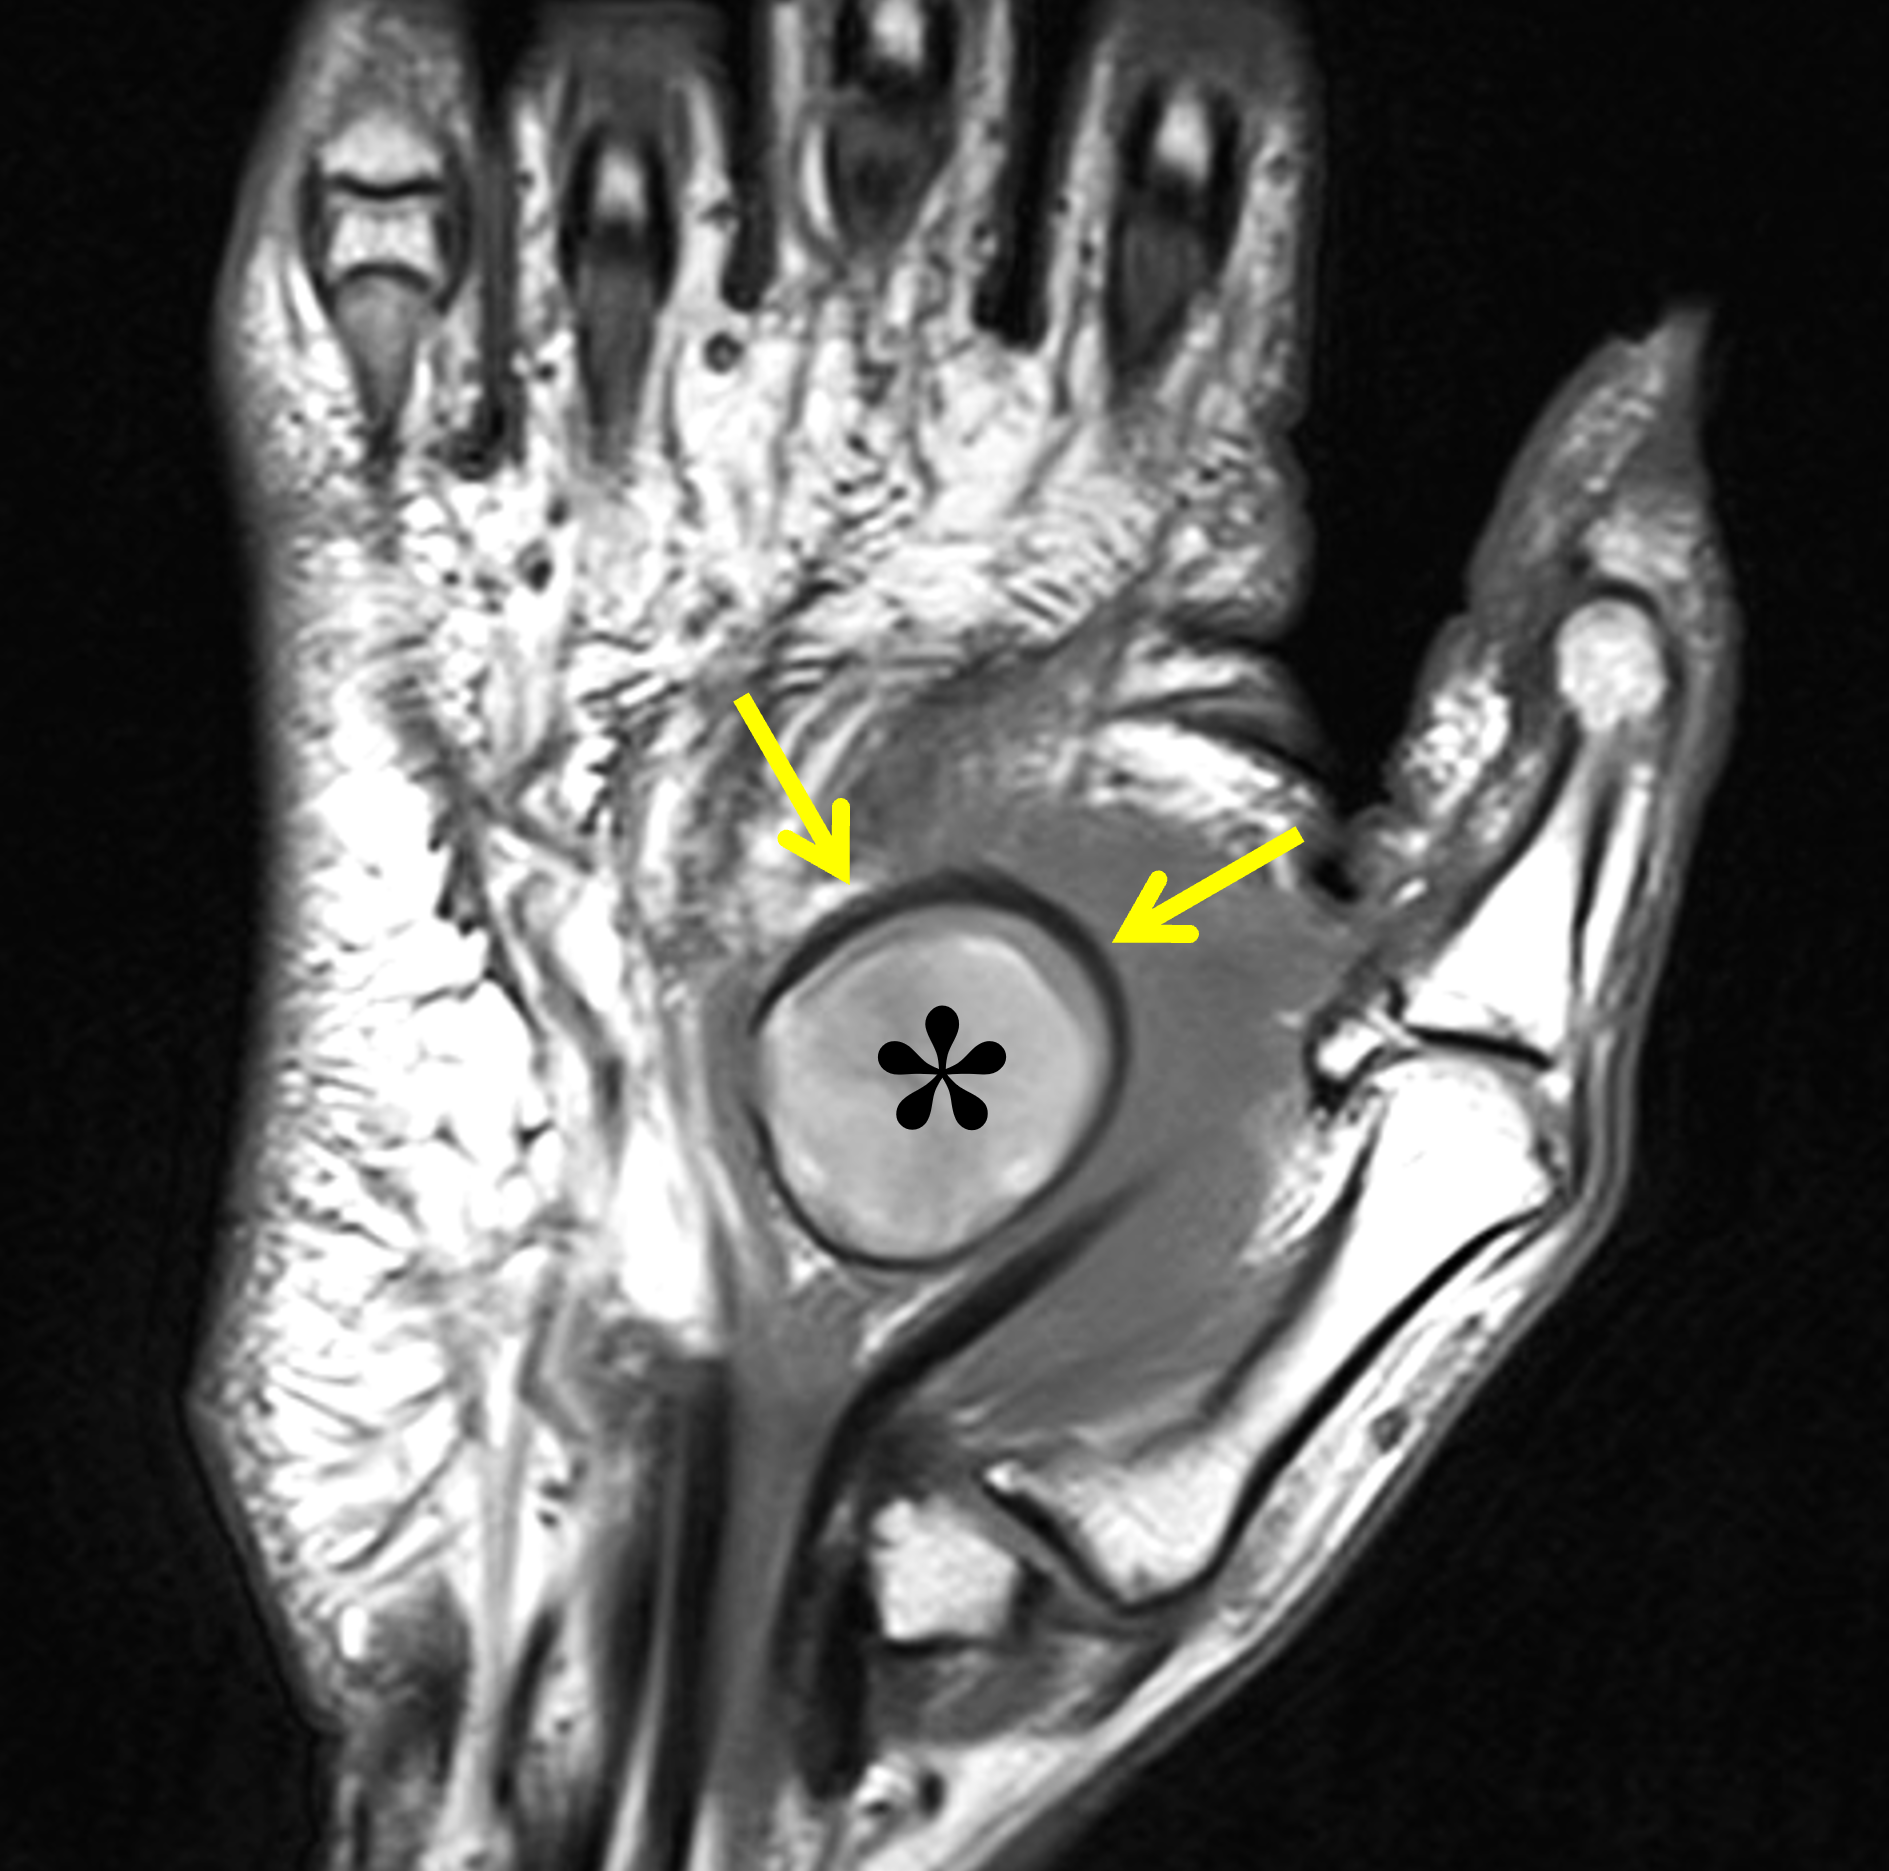
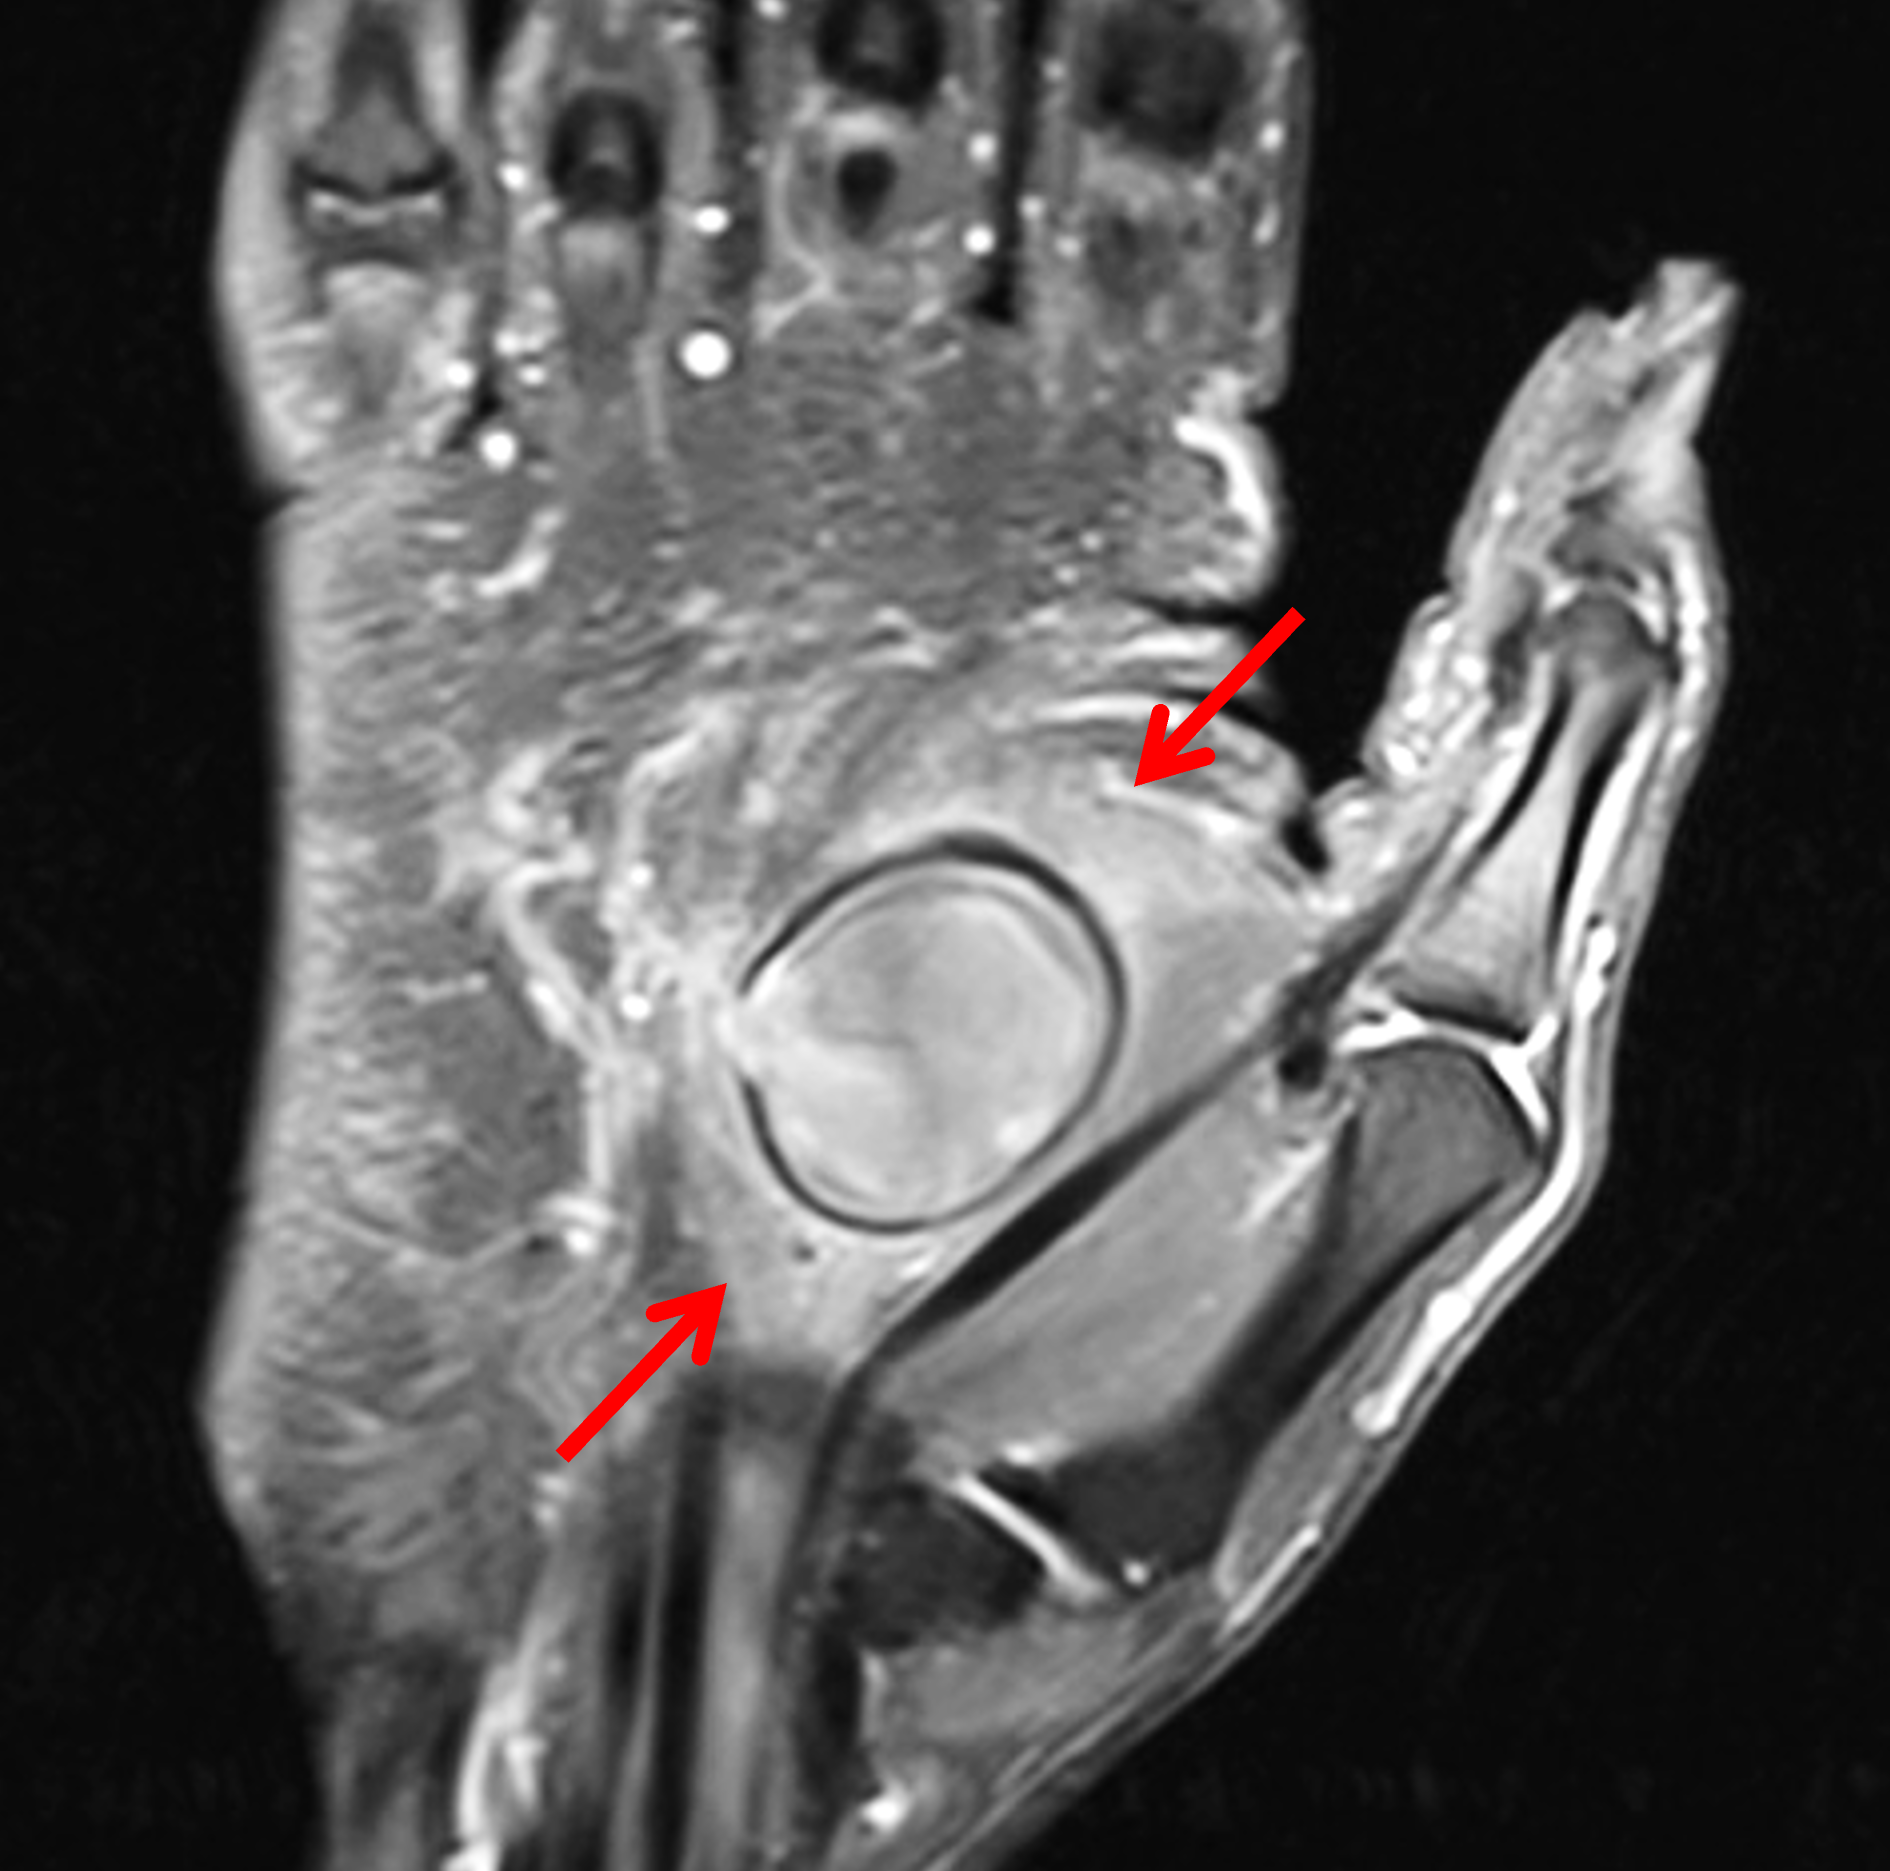
Figure 8: Subacute hematoma in the palm after a laceration. (8A) Axial T1-weighted image shows a round, subcutaneous mass with internal signal hyperintense compared to skeletal muscle (asterisk) representing met-hemoglobin, and a hypointense peripheral hemosiderin rim (arrows). (8B) Axial fat-suppressed, proton density-weighted image shows heterogeneous high signal intensity blood centrally and a hypointense, hemosiderin rim (arrows). (8C) Coronal T1-weighted image confirms the high signal intensity blood products centrally (asterisk) and the dark, peripheral hemosiderin rim (arrows). (8D) Coronal fat-suppressed, T1-weighted image obtained after intravenous contrast administration demonstrates mild surrounding enhancing soft tissue inflammation (arrows), but no internal enhancement. Careful comparison with pre-contrast images is necessary to evaluate enhancement when a lesion is hyperintense on T1-weighted images. The hematoma was excised because of patient discomfort.
A subcutaneous abscess is another fluid collection that may present as a palpable abnormality. Unlike the case for epidermoid inclusions cysts, patients are frequently symptomatic with systemic signs such as fever, as well as local findings of redness, tenderness, and swelling. Most subcutaneous abscesses are caused by bacterial spread through breaches in the skin surface; therefore, physical examination with direct inspection are helpful in the diagnosis. MRI has an overall high sensitivity and good specificity for the diagnosis of an abscess.22,23 Typically the abscess cavity is low-to-intermediate signal intensity compared to skeletal muscle on T1-weighted images and hyperintense on fluid-sensitive sequences. Specificity is increased when a T1-hyperintense pseudocapsule is present (the “penumbra sign”), which represents a rim of vascularized granulation tissue (Figure 9). The penumbra sign may be absent in subacute infections. A draining sinus tract to the skin surface may be identified on MRI. As with other fluid-filled structures, the abscess cavity should demonstrate no internal enhancement, while the capsular rim and surrounding inflamed soft tissues often demonstrate avid, thick enhancement. Hematomas and epidermoid inclusion cysts may also become secondarily infected necessitating incision and drainage. On MRI, a ruptured or inflamed epidermoid inclusion cyst may be difficult to differentiate from an abscess, with both showing internal debris and peripheral thick enhancement.
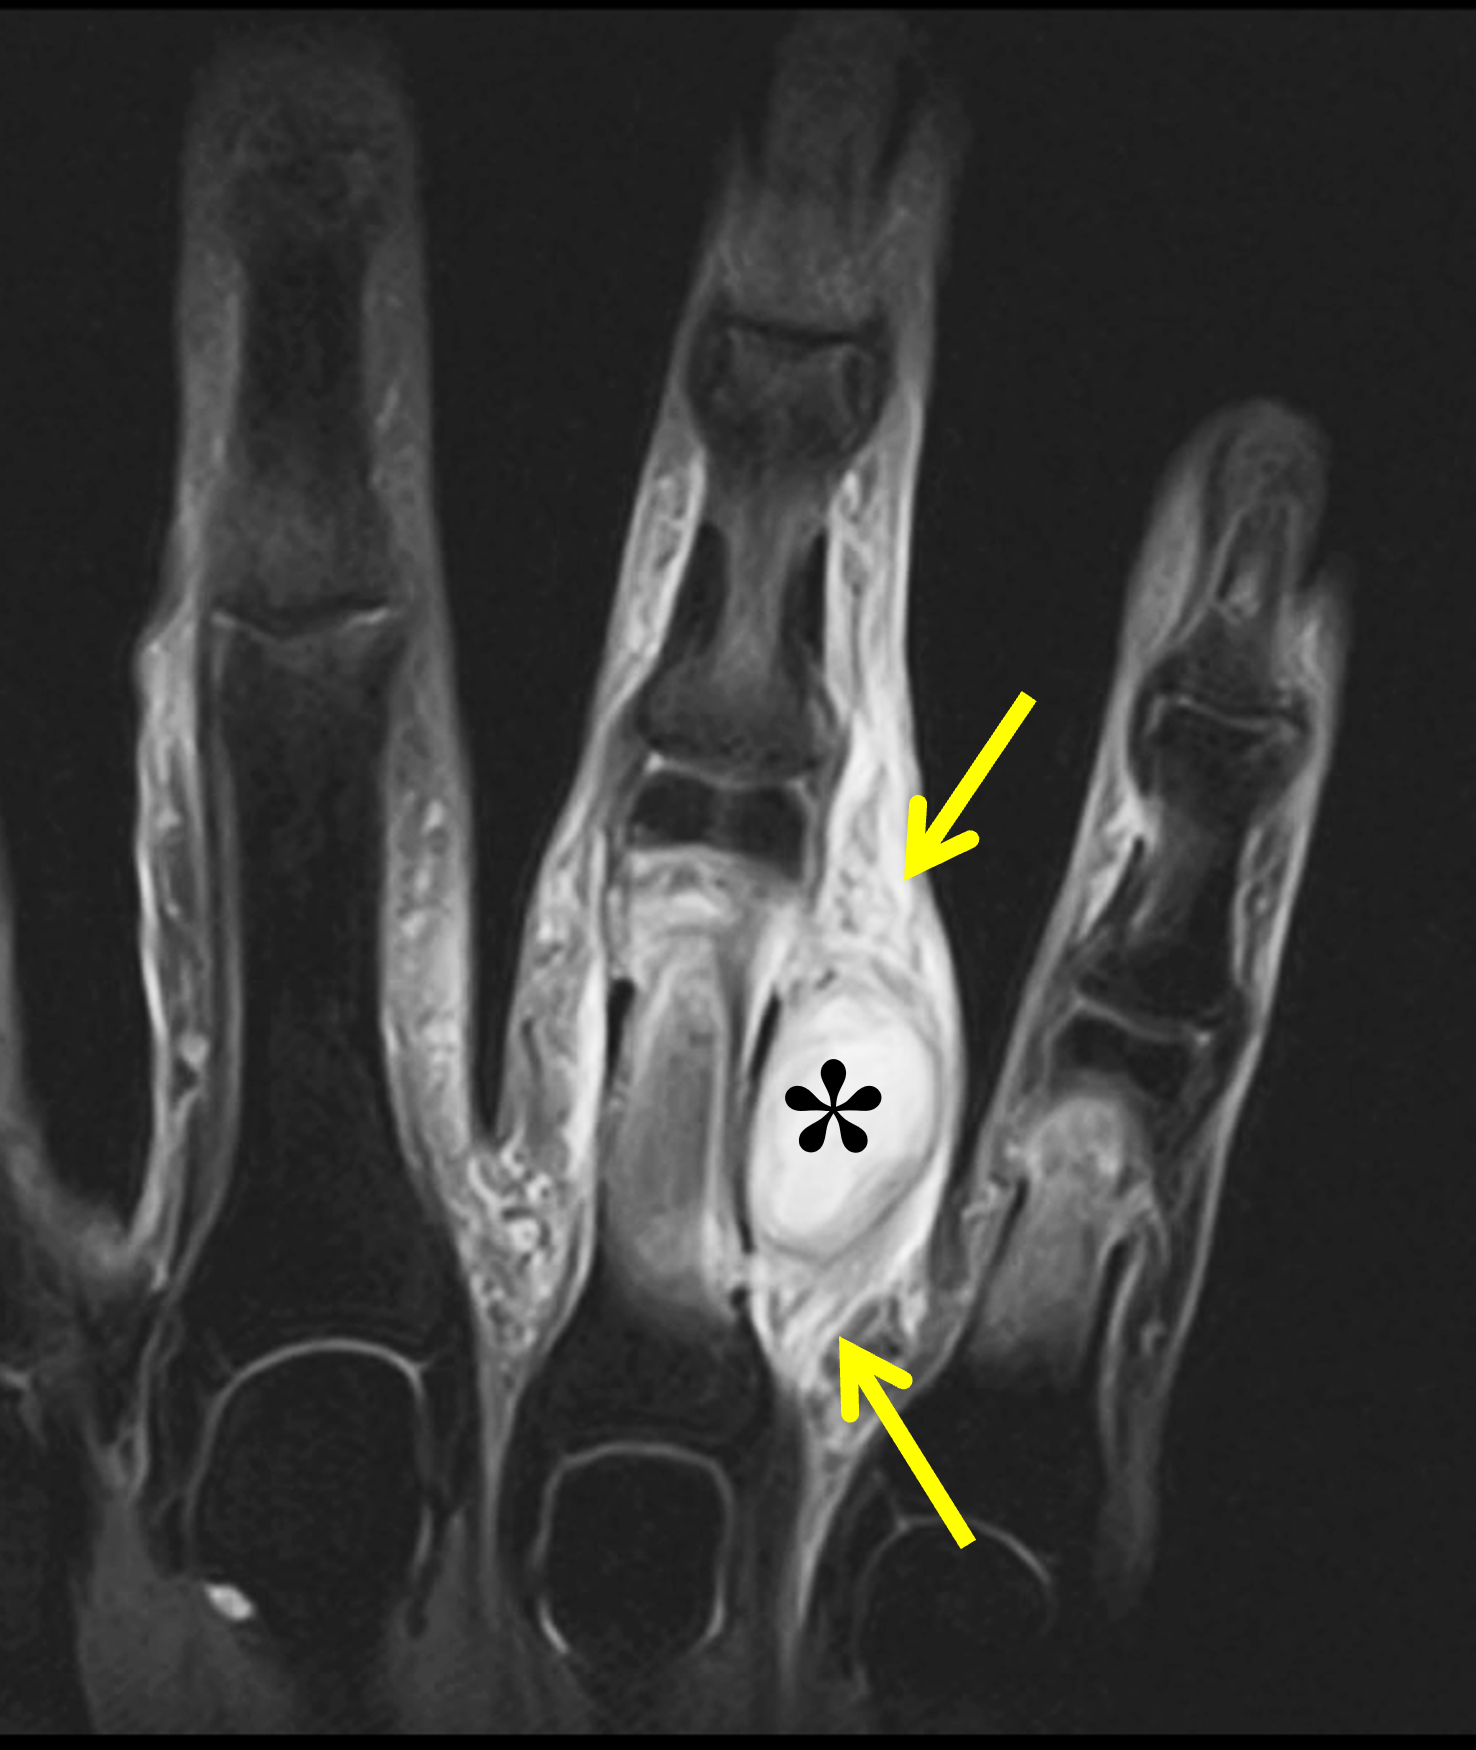
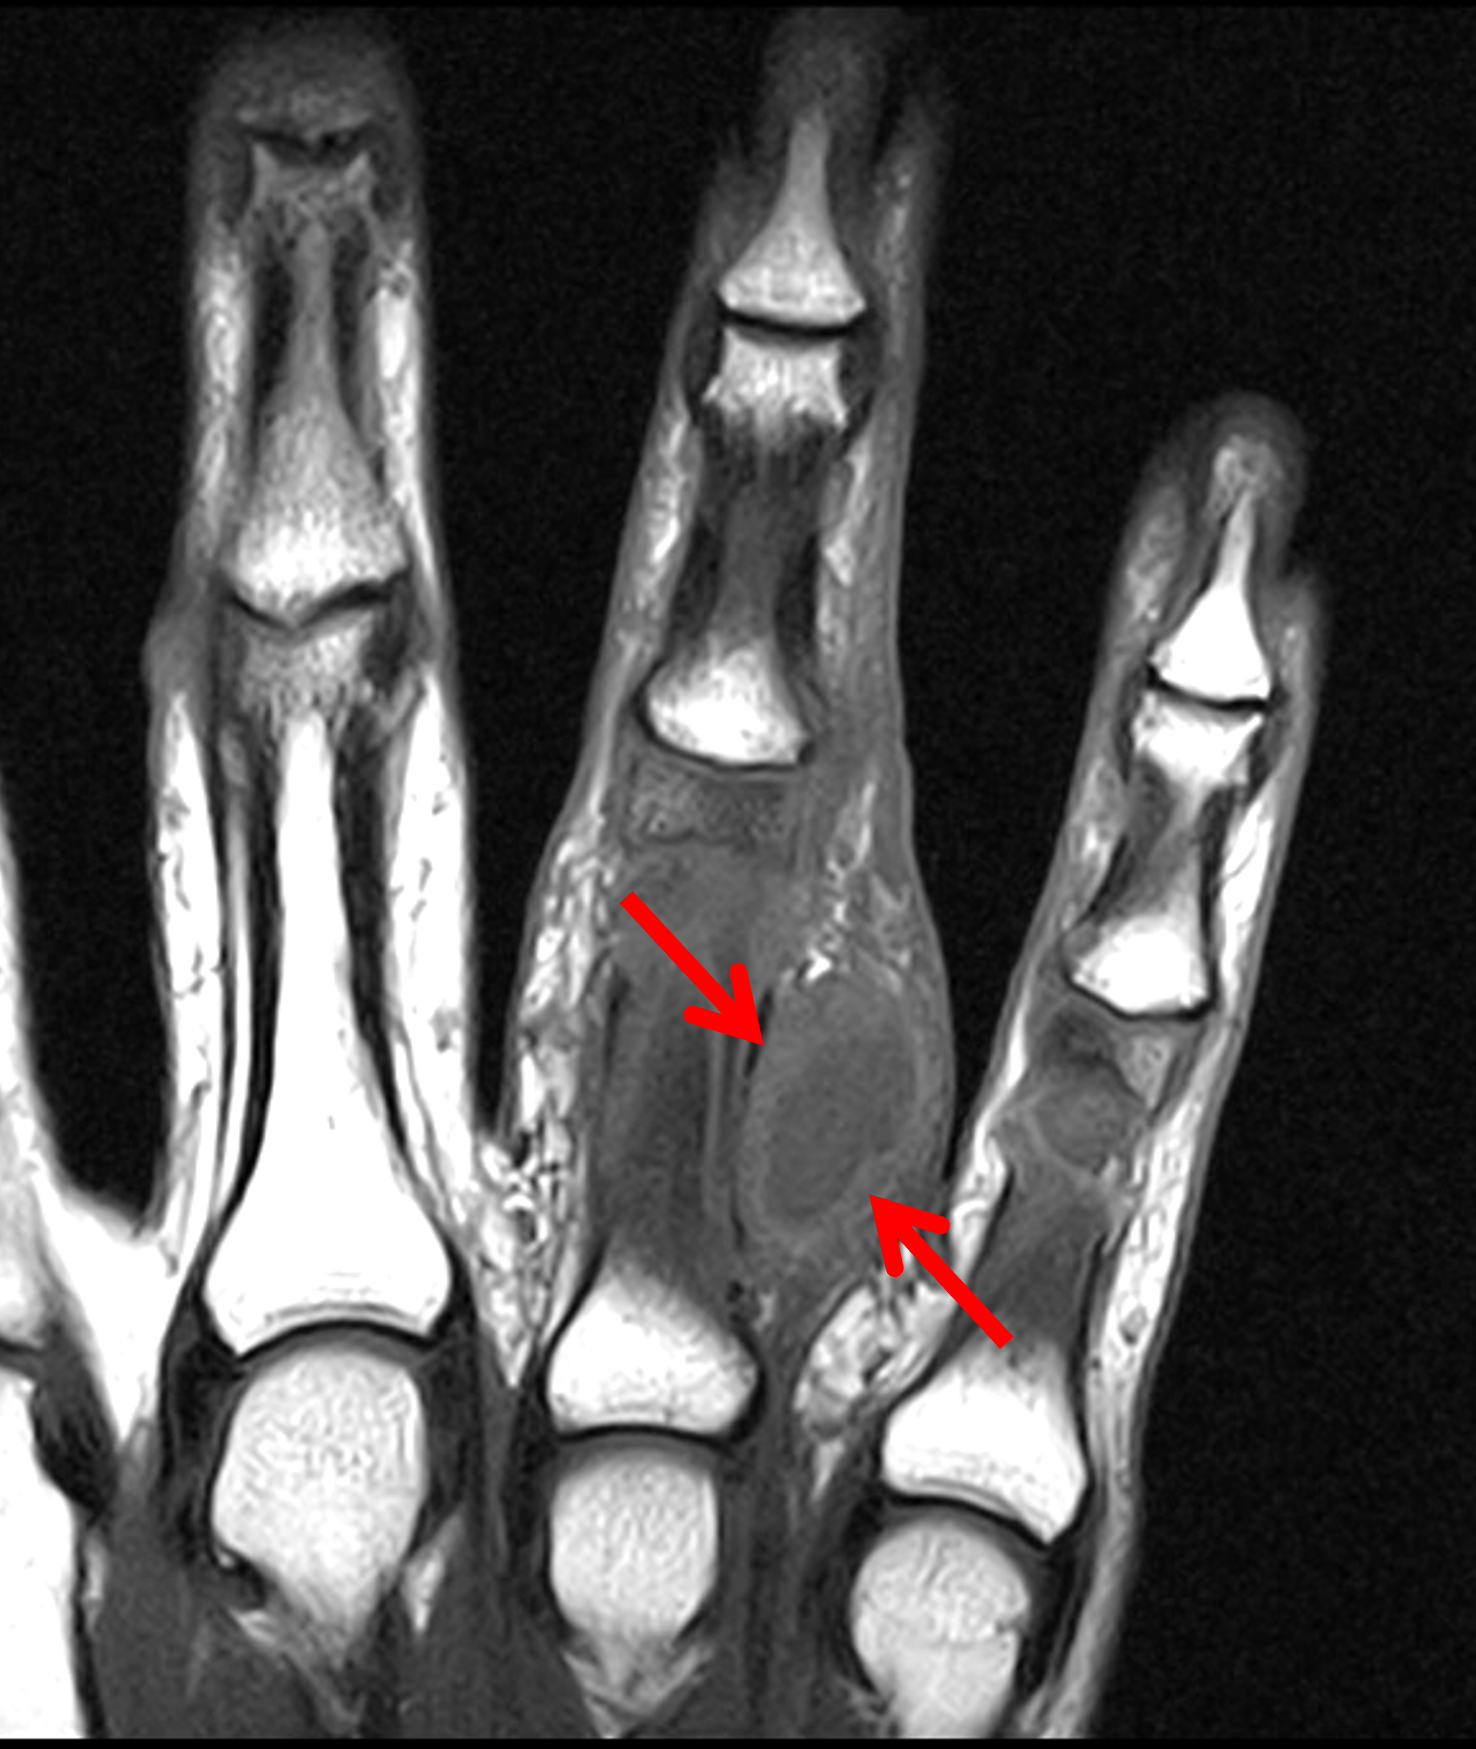
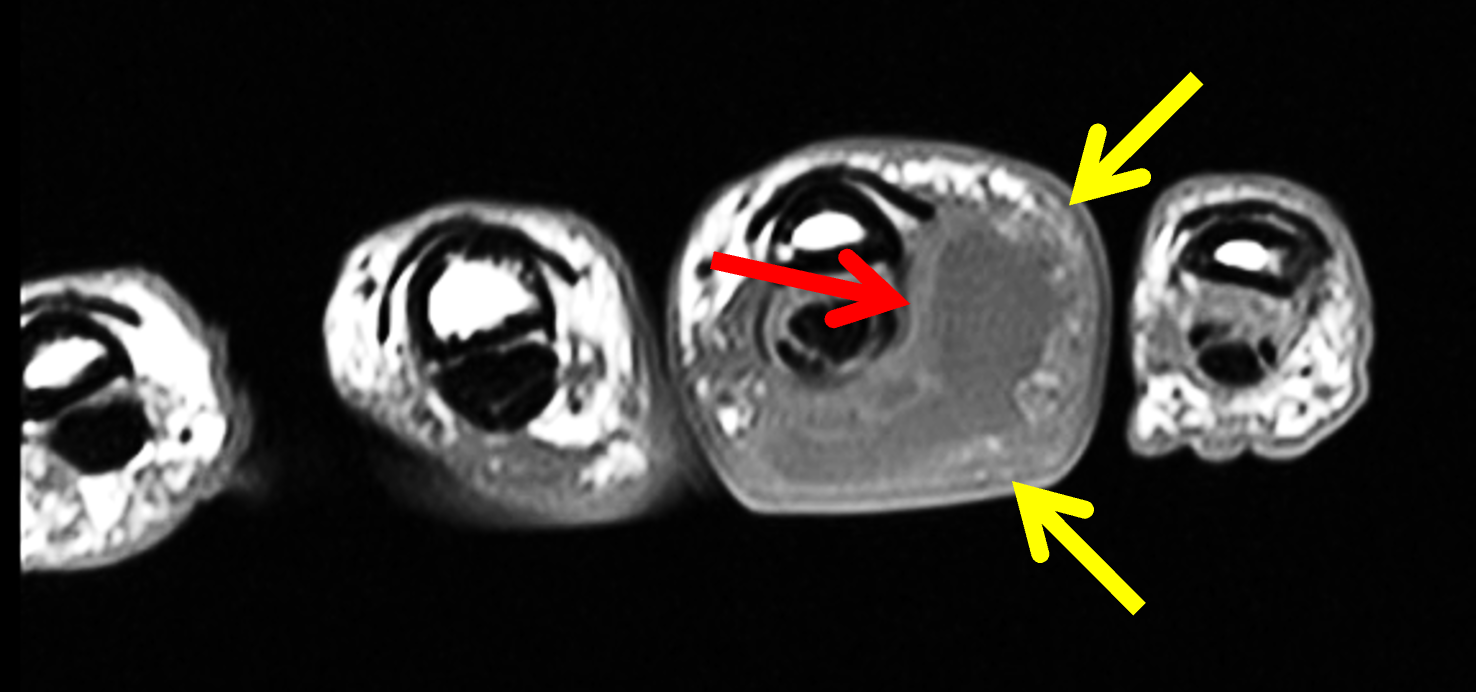
Figure 9: Subcutaneous abscess in the ring finger. (9A) Coronal fat-suppressed, T2-weighted image shows internal fluid-intensity signal (asterisk) in the subcutaneous tissues and diffuse surrounding edema/cellulitis (arrows). (9B) Coronal T1-weighted image demonstrates a shaggy, high signal-intensity rim (arrows) surrounding the central fluid (the “penumbra sign”). (9C) Axial T1-weighted image shows an indistinct margin of the fluid collection (yellow arrows), in contrast to an uncomplicated epidermoid inclusion cyst or ganglion, as well as a high signal-intensity penumbra (red arrow).
Occasionally infection may result in enlarged, reactive or suppurative regional lymph nodes that can present as palpable masses (Figures 10 and 11). Lymphadenopathy may be due to primary or metastatic malignancy, or nonneoplastic causes including infections (lymphadenitis), systemic disease such as sarcoidosis, or related to drugs or vaccines.24 The distribution of lymph nodes, imaging characteristics of the enlarged lymph nodes (calcification, necrosis, hypervascularity), nearby findings of infection or malignancy, and clinical history are all helpful in evaluating the clinical significance and potential etiologies.
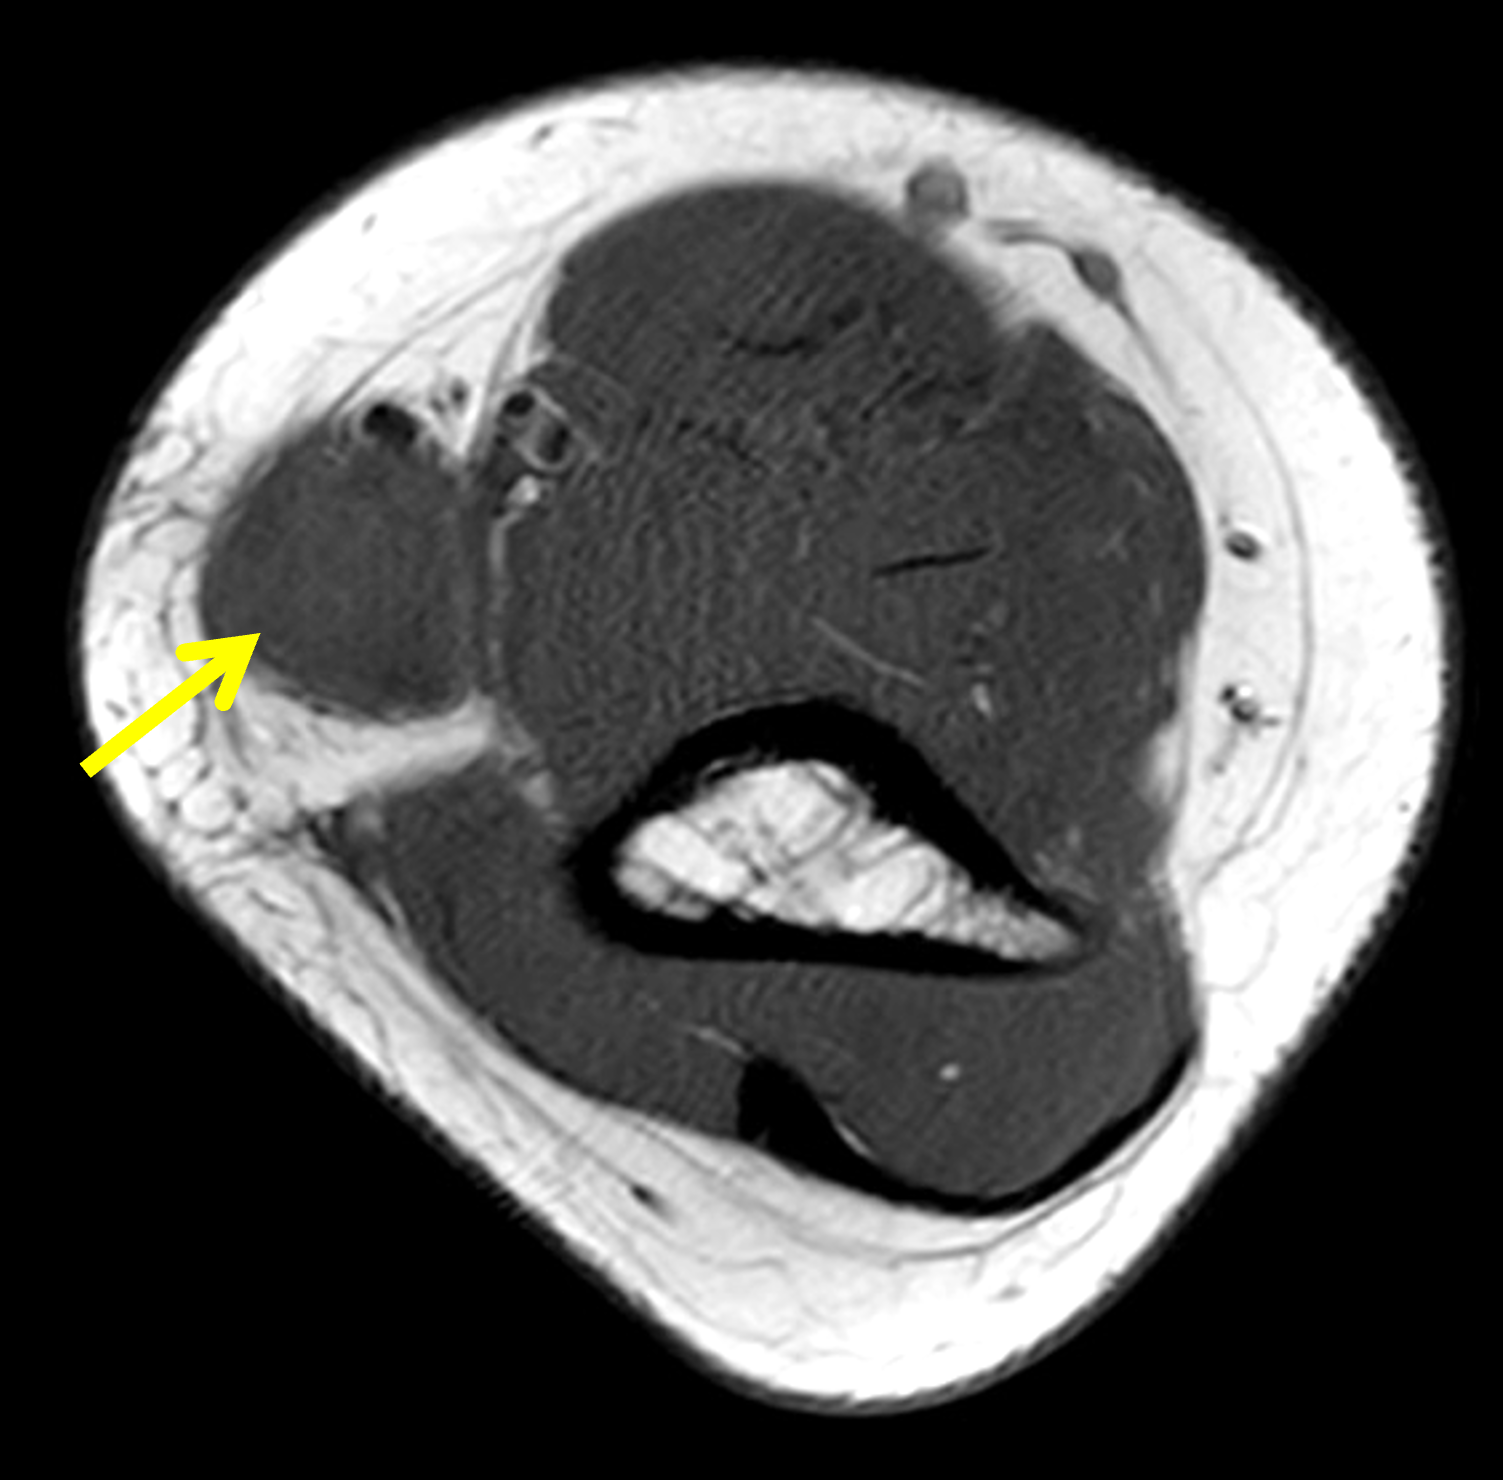
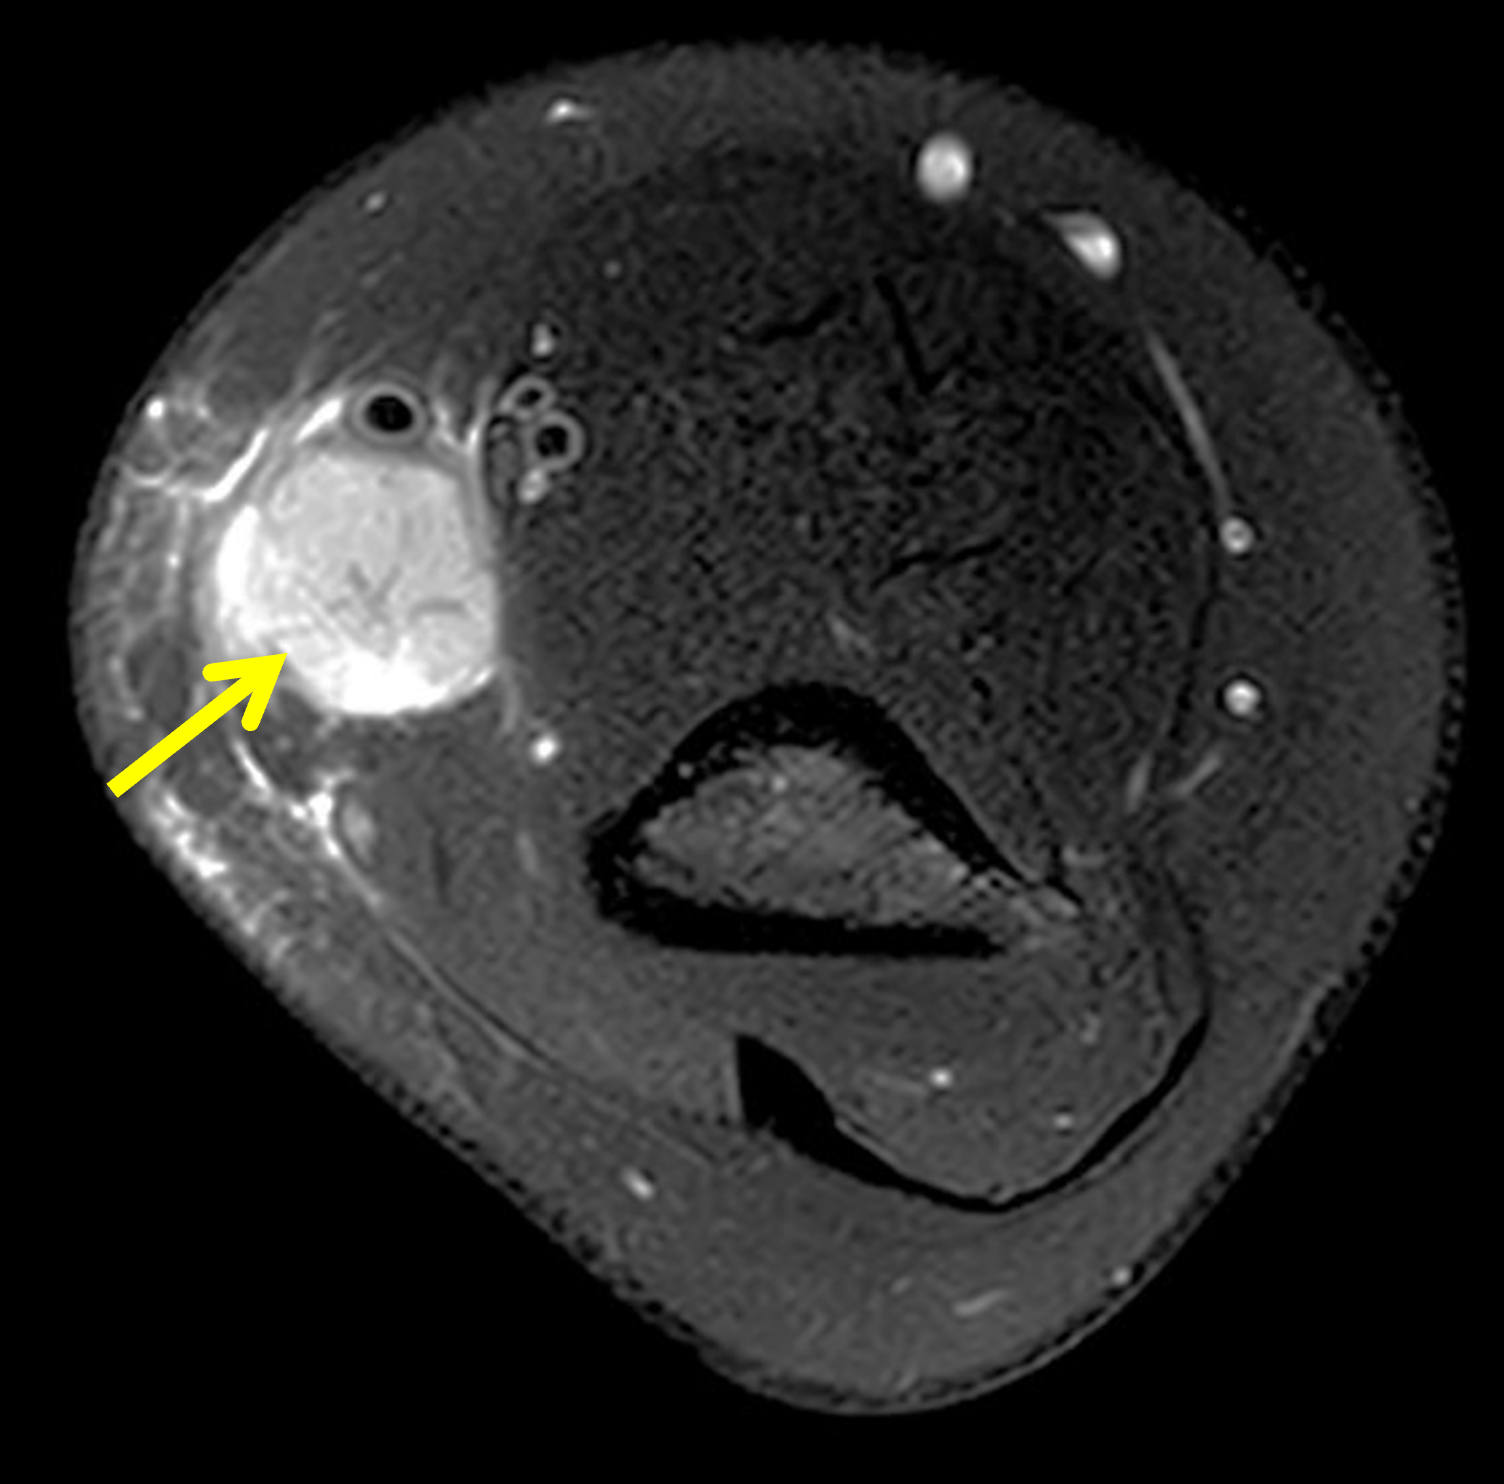

Figure 10: Epitrochlear lymphadenopathy due to cat scratch disease in a 14-year-old girl. (10A) Axial T1-weighted image shows a subcutaneous mass (arrow) along the medial side of the distal arm, isointense compared to skeletal muscle. (10B) Axial fat-suppressed, T2-weighted image shows the mass is hyperintense, but less bright than fluid, with internal radiating architecture (arrow). (10C) Coronal STIR image demonstrates that the mass is part of a chain of enlarged epitrochlear lymph nodes (arrows) with surrounding subcutaneous inflammation. The appearance and location of the lymph nodes are characteristic of bartonellosis. A clinical history of a recent encounter with a cat and clinical signs of infection help in confirming the diagnosis of infectious lymphadenopathy.
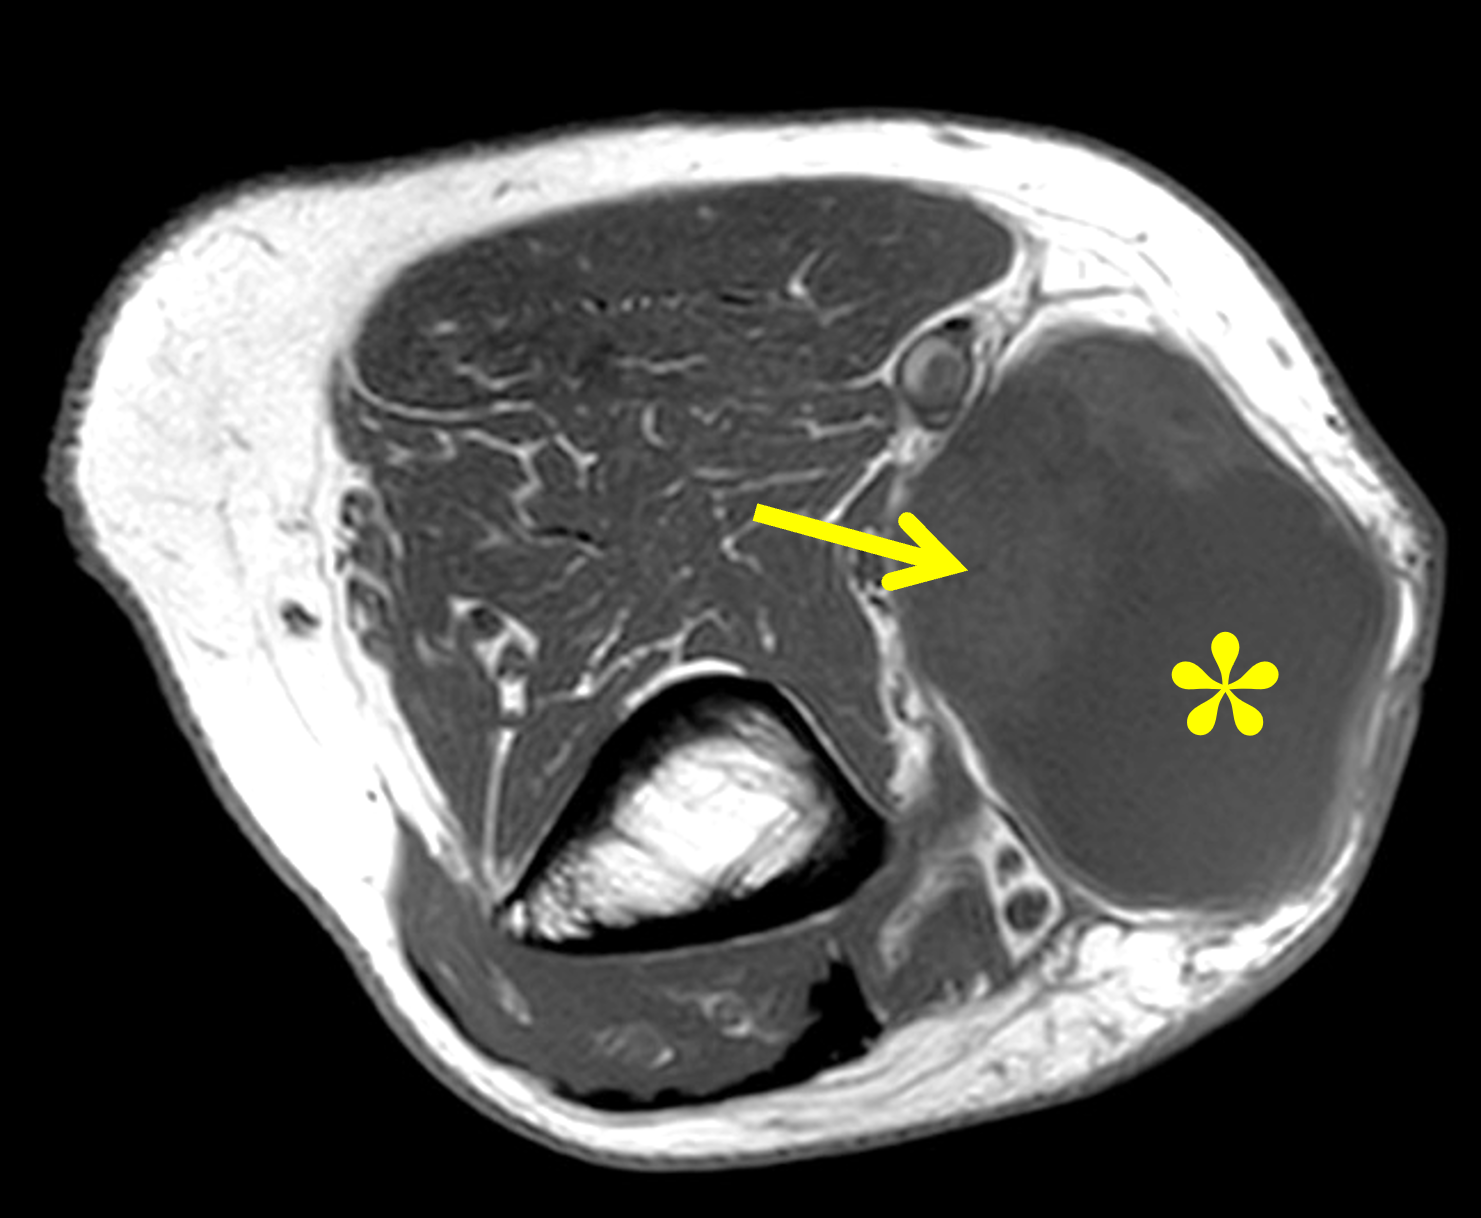


Figure 11: Suppurative lymphadenopathy. (11A) Axial T1-weighted image shows an epitrochlear subcutaneous mass with a lobulated contour containing both fluid signal (asterisk) and solid (arrow) regions. (11B) Axial fat-suppressed T2-weighted image confirms the fluid equivalent (asterisk) and nodular, solid components (arrows). (11C) Coronal STIR image shows the solid (arrow) and cystic (asterisk) subcutaneous mass with surrounding soft tissue inflammation. While the location suggests suppurative lymphadenopathy secondary to cat-scratch disease, a necrotic metastatic lymph node or primary neoplasm could look similar; careful assessment of clinical history and follow-up to document progression or resolution are required.
Ganglion cysts, discussed in previous Web Clinic, are common palpable abnormalities that are easily diagnosed by MR examination. Ganglion cysts can occur around any joint, but are most common in the wrist, accounting for 60-70% of soft tissue masses in that location. On MRI, a ganglion cyst appears as a well-defined, unilocular or multilocular structure with a thin capsule. The contents are typically hypointense compared to skeletal muscle on T1-weighted images and homogenously hyperintense on fluid-sensitive sequences.25 If intravenous contrast is administered, the contents of the cyst should show no enhancement, while the periphery may show a thin, enhancing wall, similar to an epidermoid inclusion cyst. A ganglion cyst may extend into the subcutaneous tissues; however, the deep location, potentially identifiable stalk along a joint capsule (Figure 12) or tendon sheath (Figure 13), as well as the homogenous contents help differentiate ganglia from other superficial fluid-containing lesions, such as an epidermoid inclusion cyst.
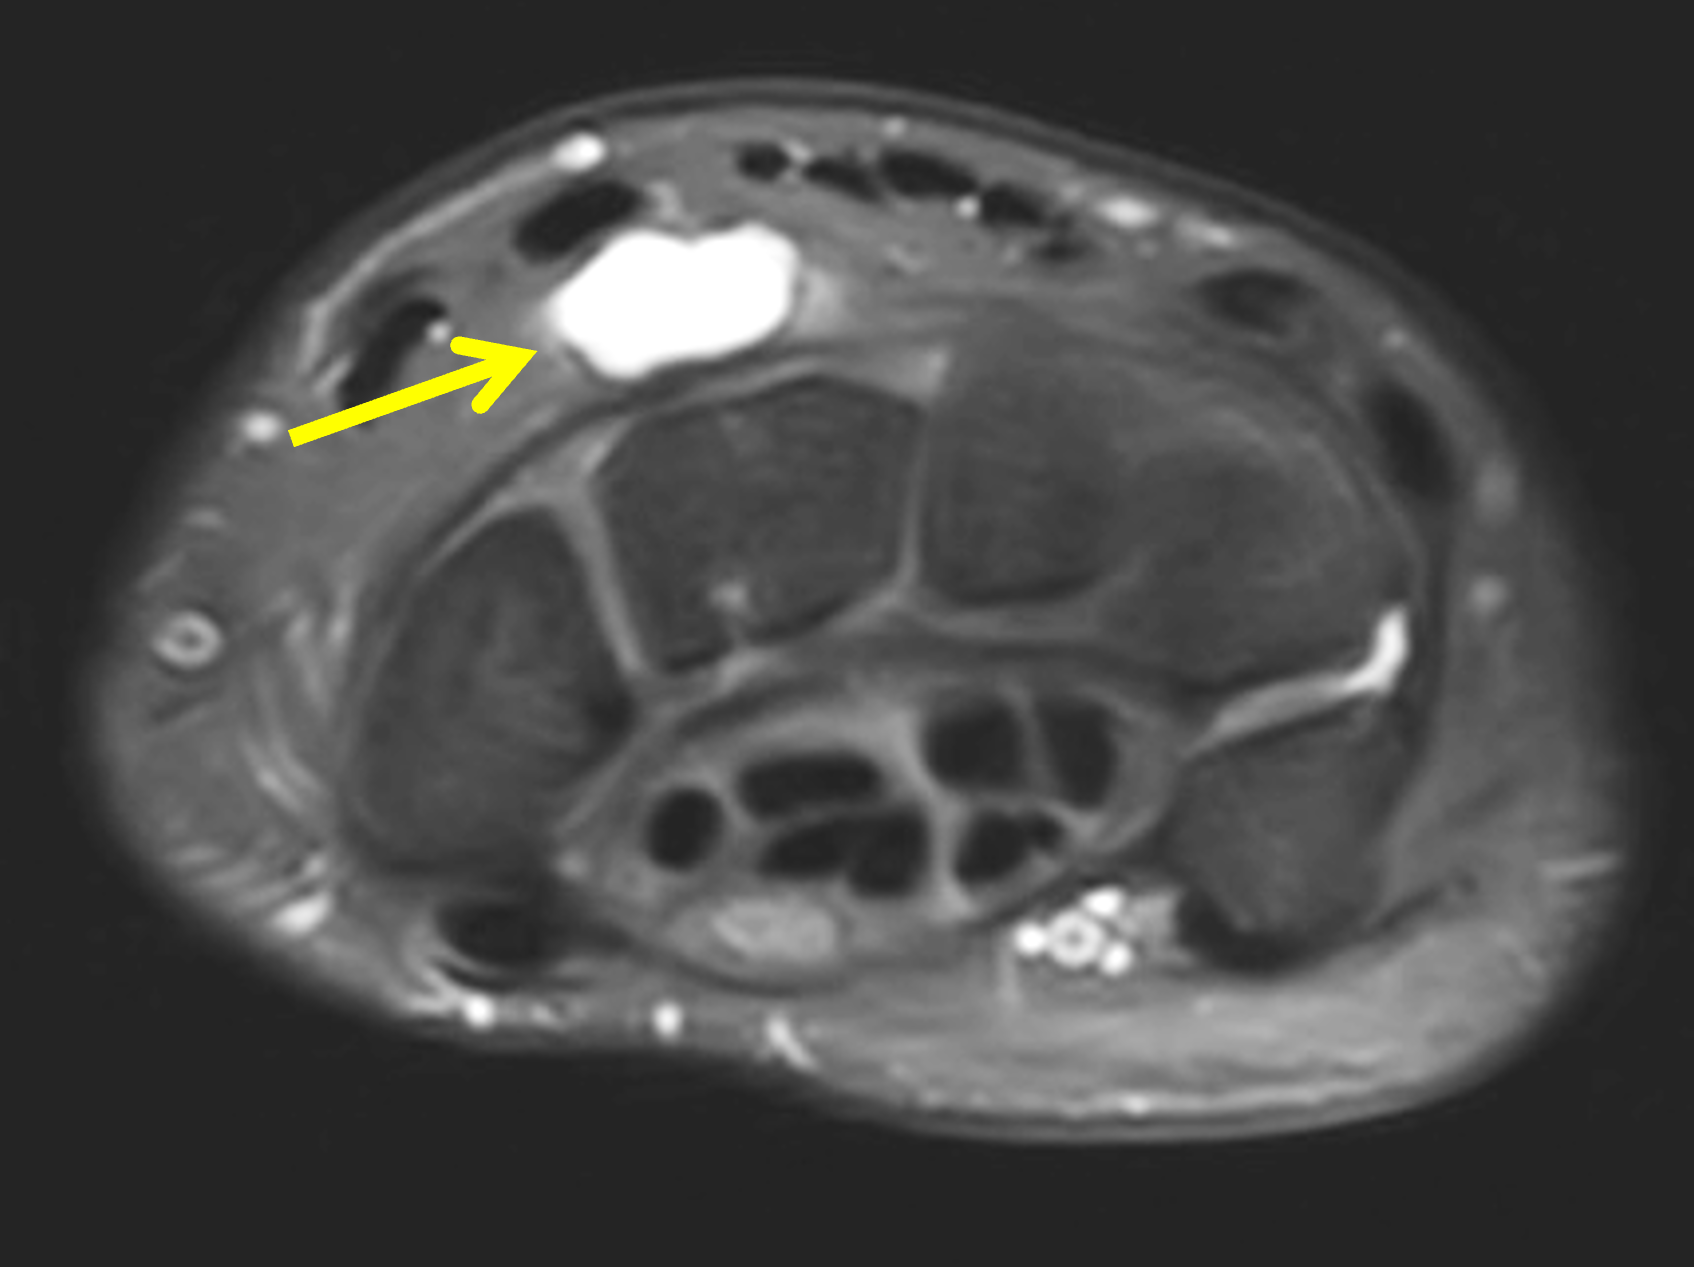

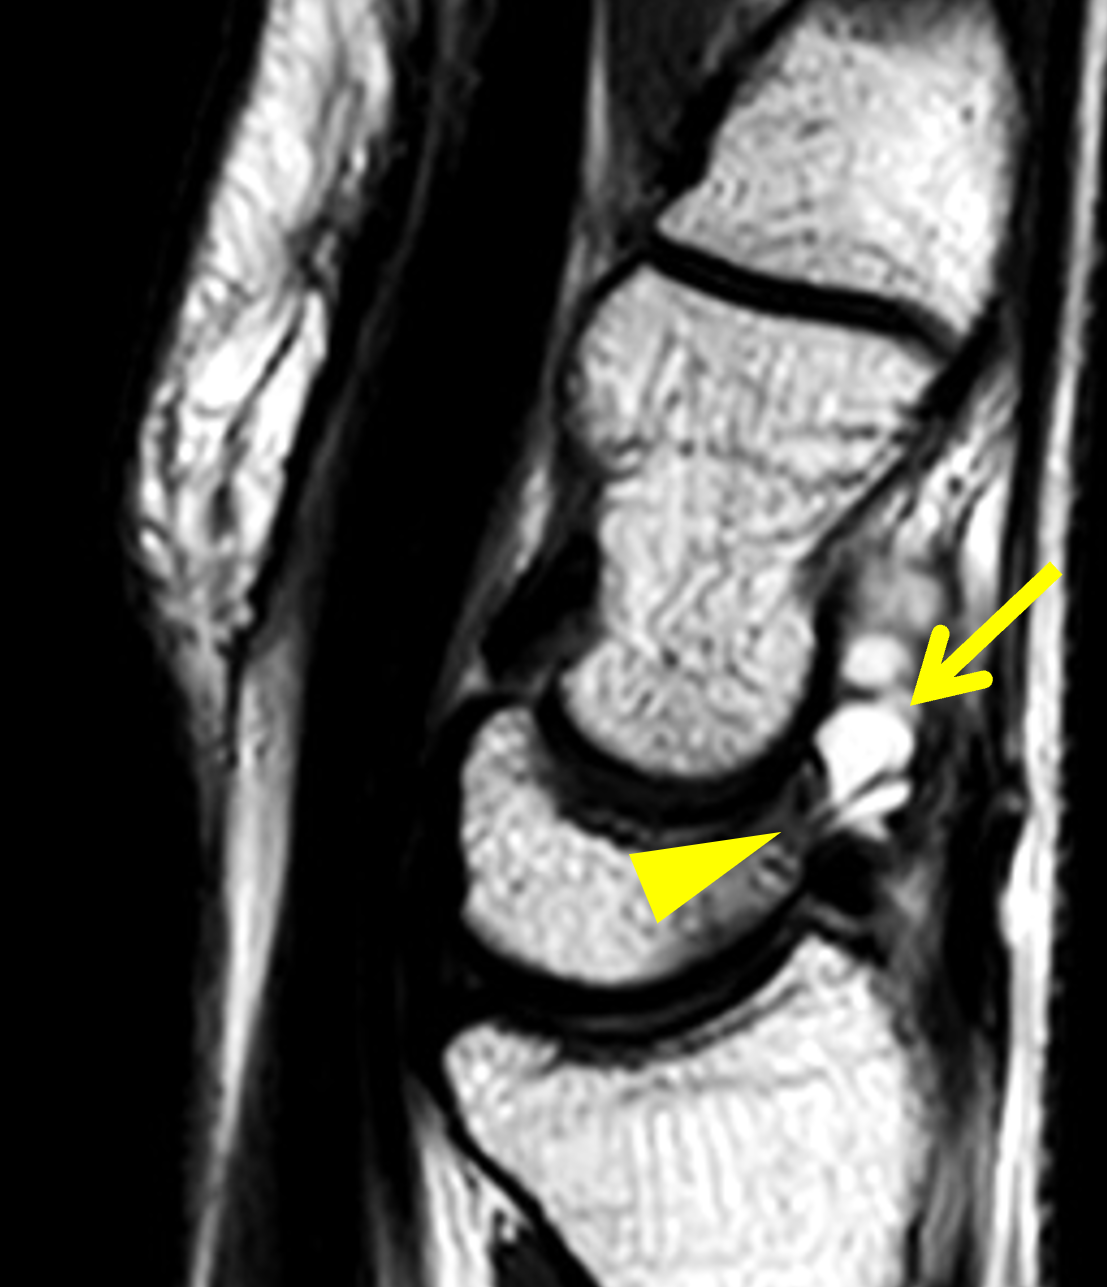
Figure 12: Dorsal wrist ganglion cyst. (12A) Axial fat-suppressed, proton density-weighted image shows a cystic lesion (arrow) dorsal to the wrist bones, not extending to skin. (12B) Coronal fat-suppressed, proton density-weighted image shows that the cyst is multilocular (arrows), with thin septations. (12C) Sagittal T2-weighted image demonstrates the cyst (arrow) along the dorsal aspect of the midcarpal compartment, with a thin neck (arrowhead) attached to the dorsal capsule of the scapholunate joint. The appearance and location are typical for a dorsal wrist ganglion cyst.
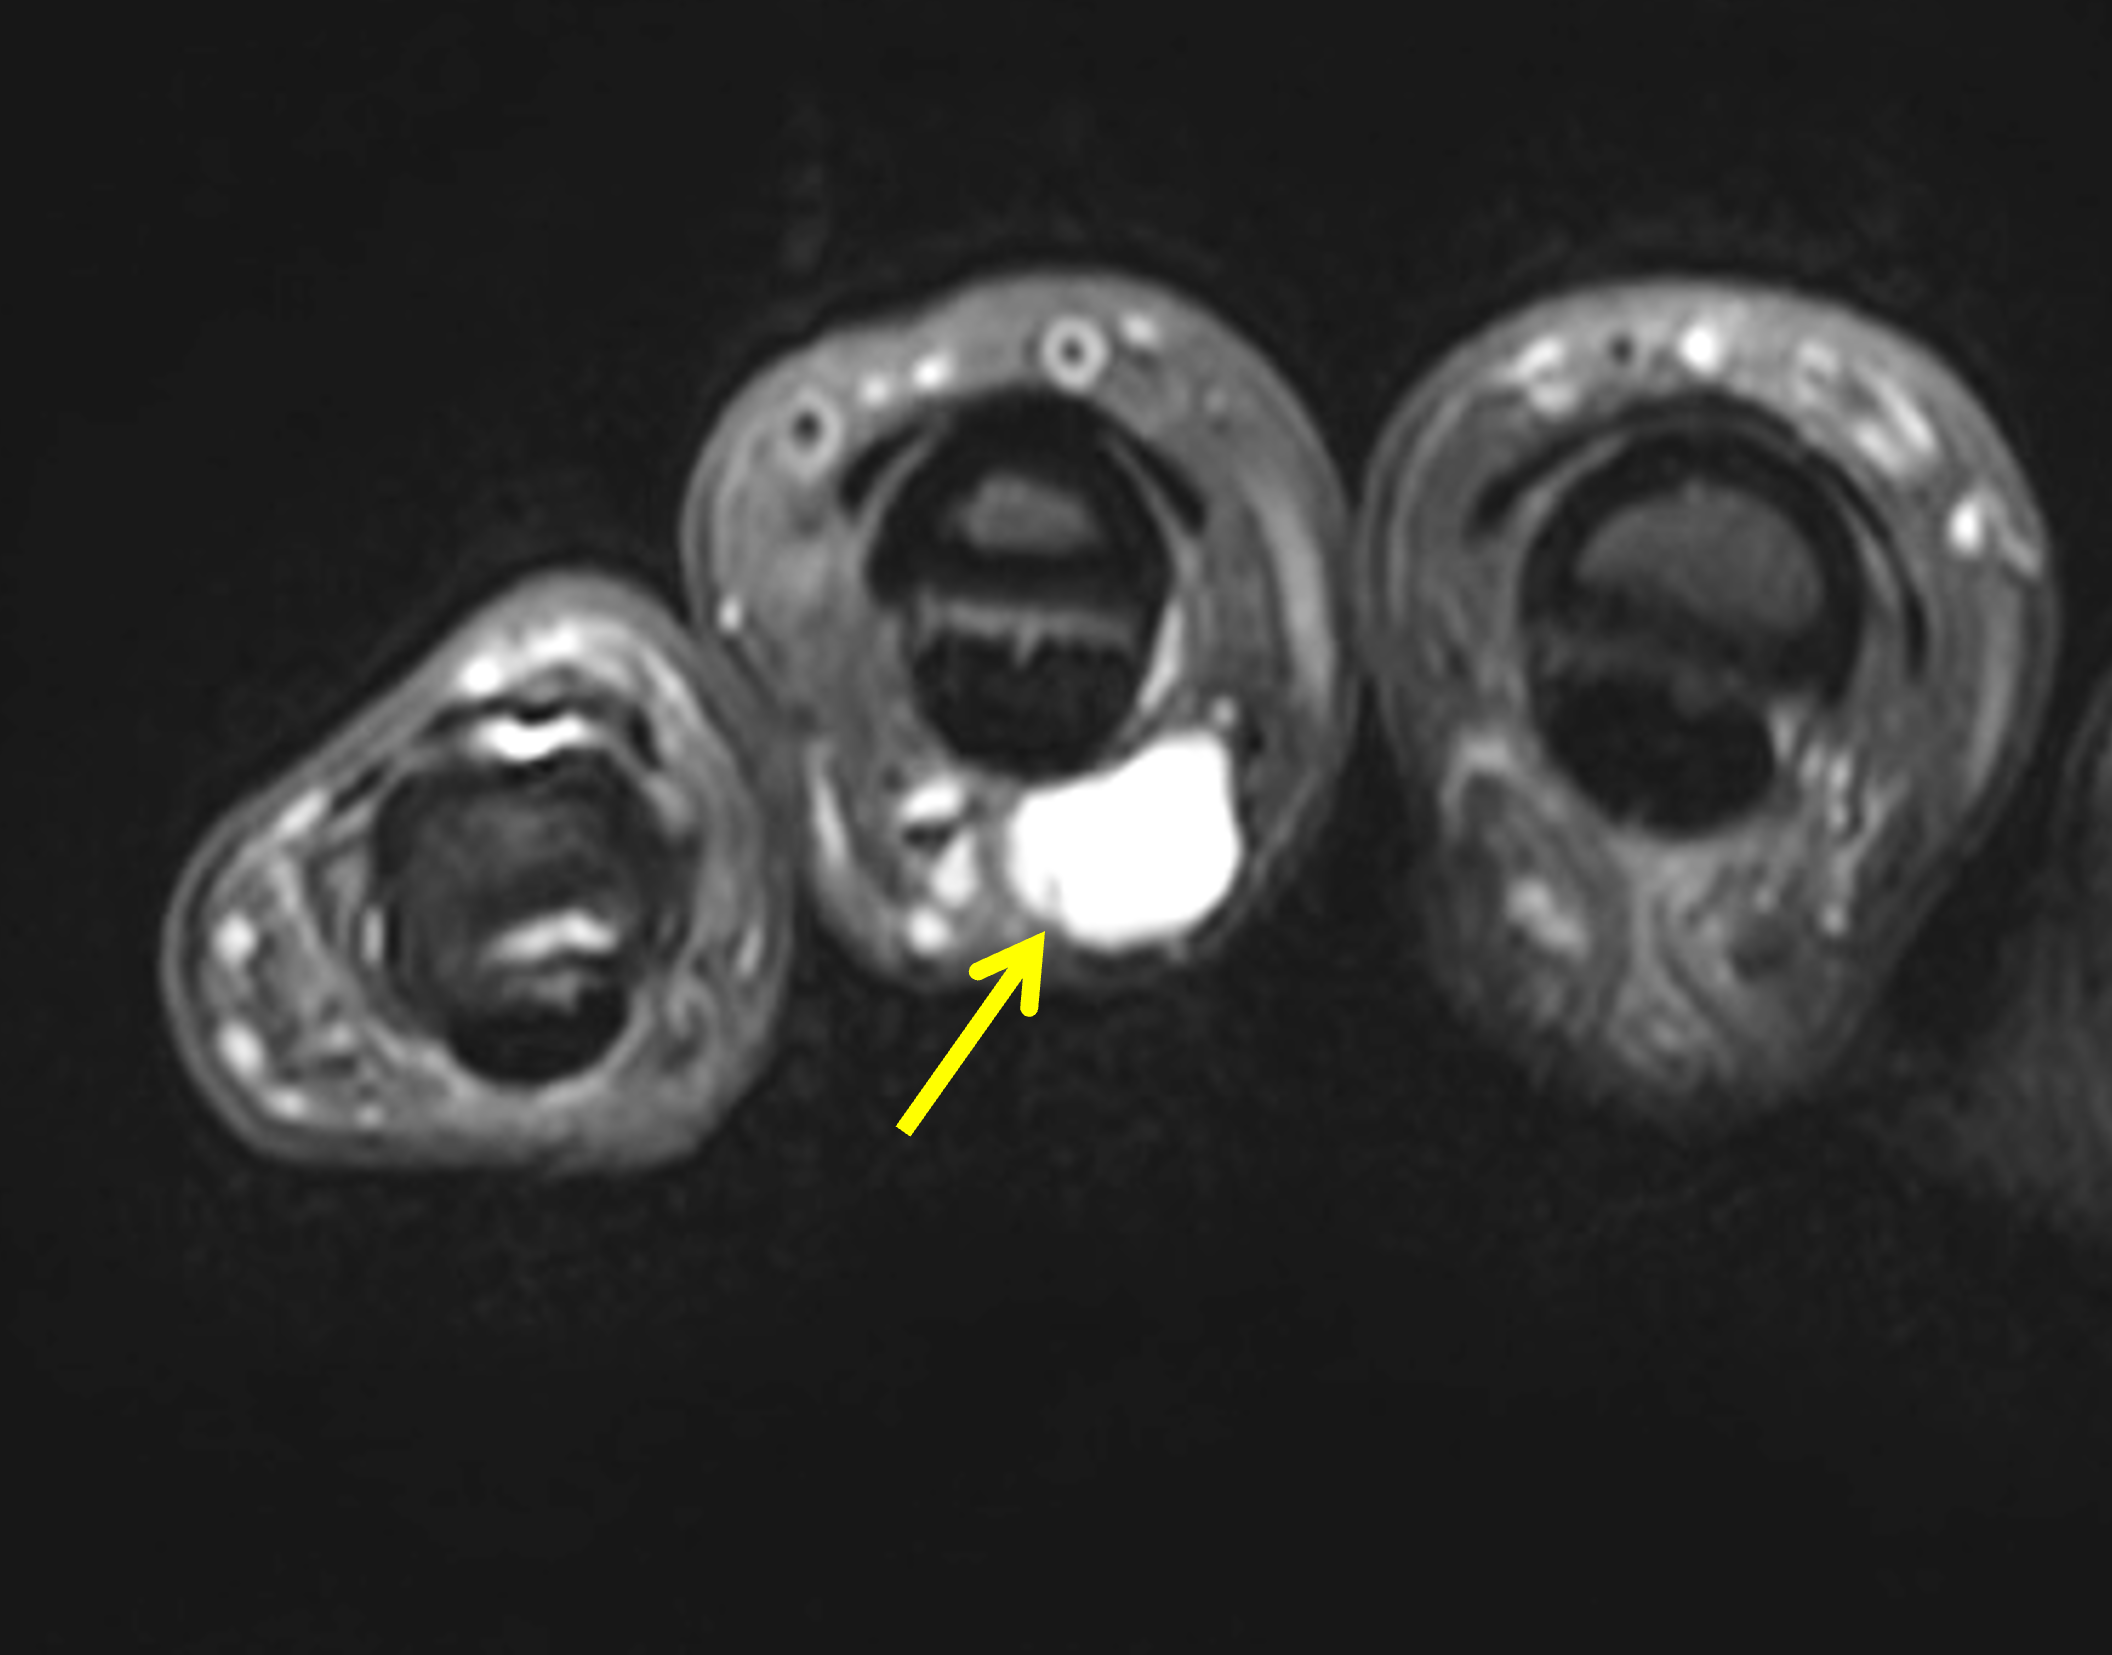

Figure 13: Tendon sheath ganglion (retinacular) cyst in the finger. (13A) Axial fat-suppressed, proton density-weighted image shows a homogeneous, sharply-marginated, hyperintense cyst (arrow) along the palmar aspect of the ring finger flexor tendon sheath. (13B) Sagittal T2-weighted shows the cyst (arrow) inseparable from the A2 pulley.
A parameniscal cyst is a fluid-filled structure that may present as a palpable abnormality around the knee (Figure 14). These cysts are secondary to fluid extrusion from a meniscus tear.26 MRI is both highly sensitive and specific for detection of parameniscal cysts and their underlying meniscal tears. Parameniscal cysts secondary to a lateral meniscus tear are more likely to present as a palpable abnormality at the joint line compared to those arising from the medial meniscus.27

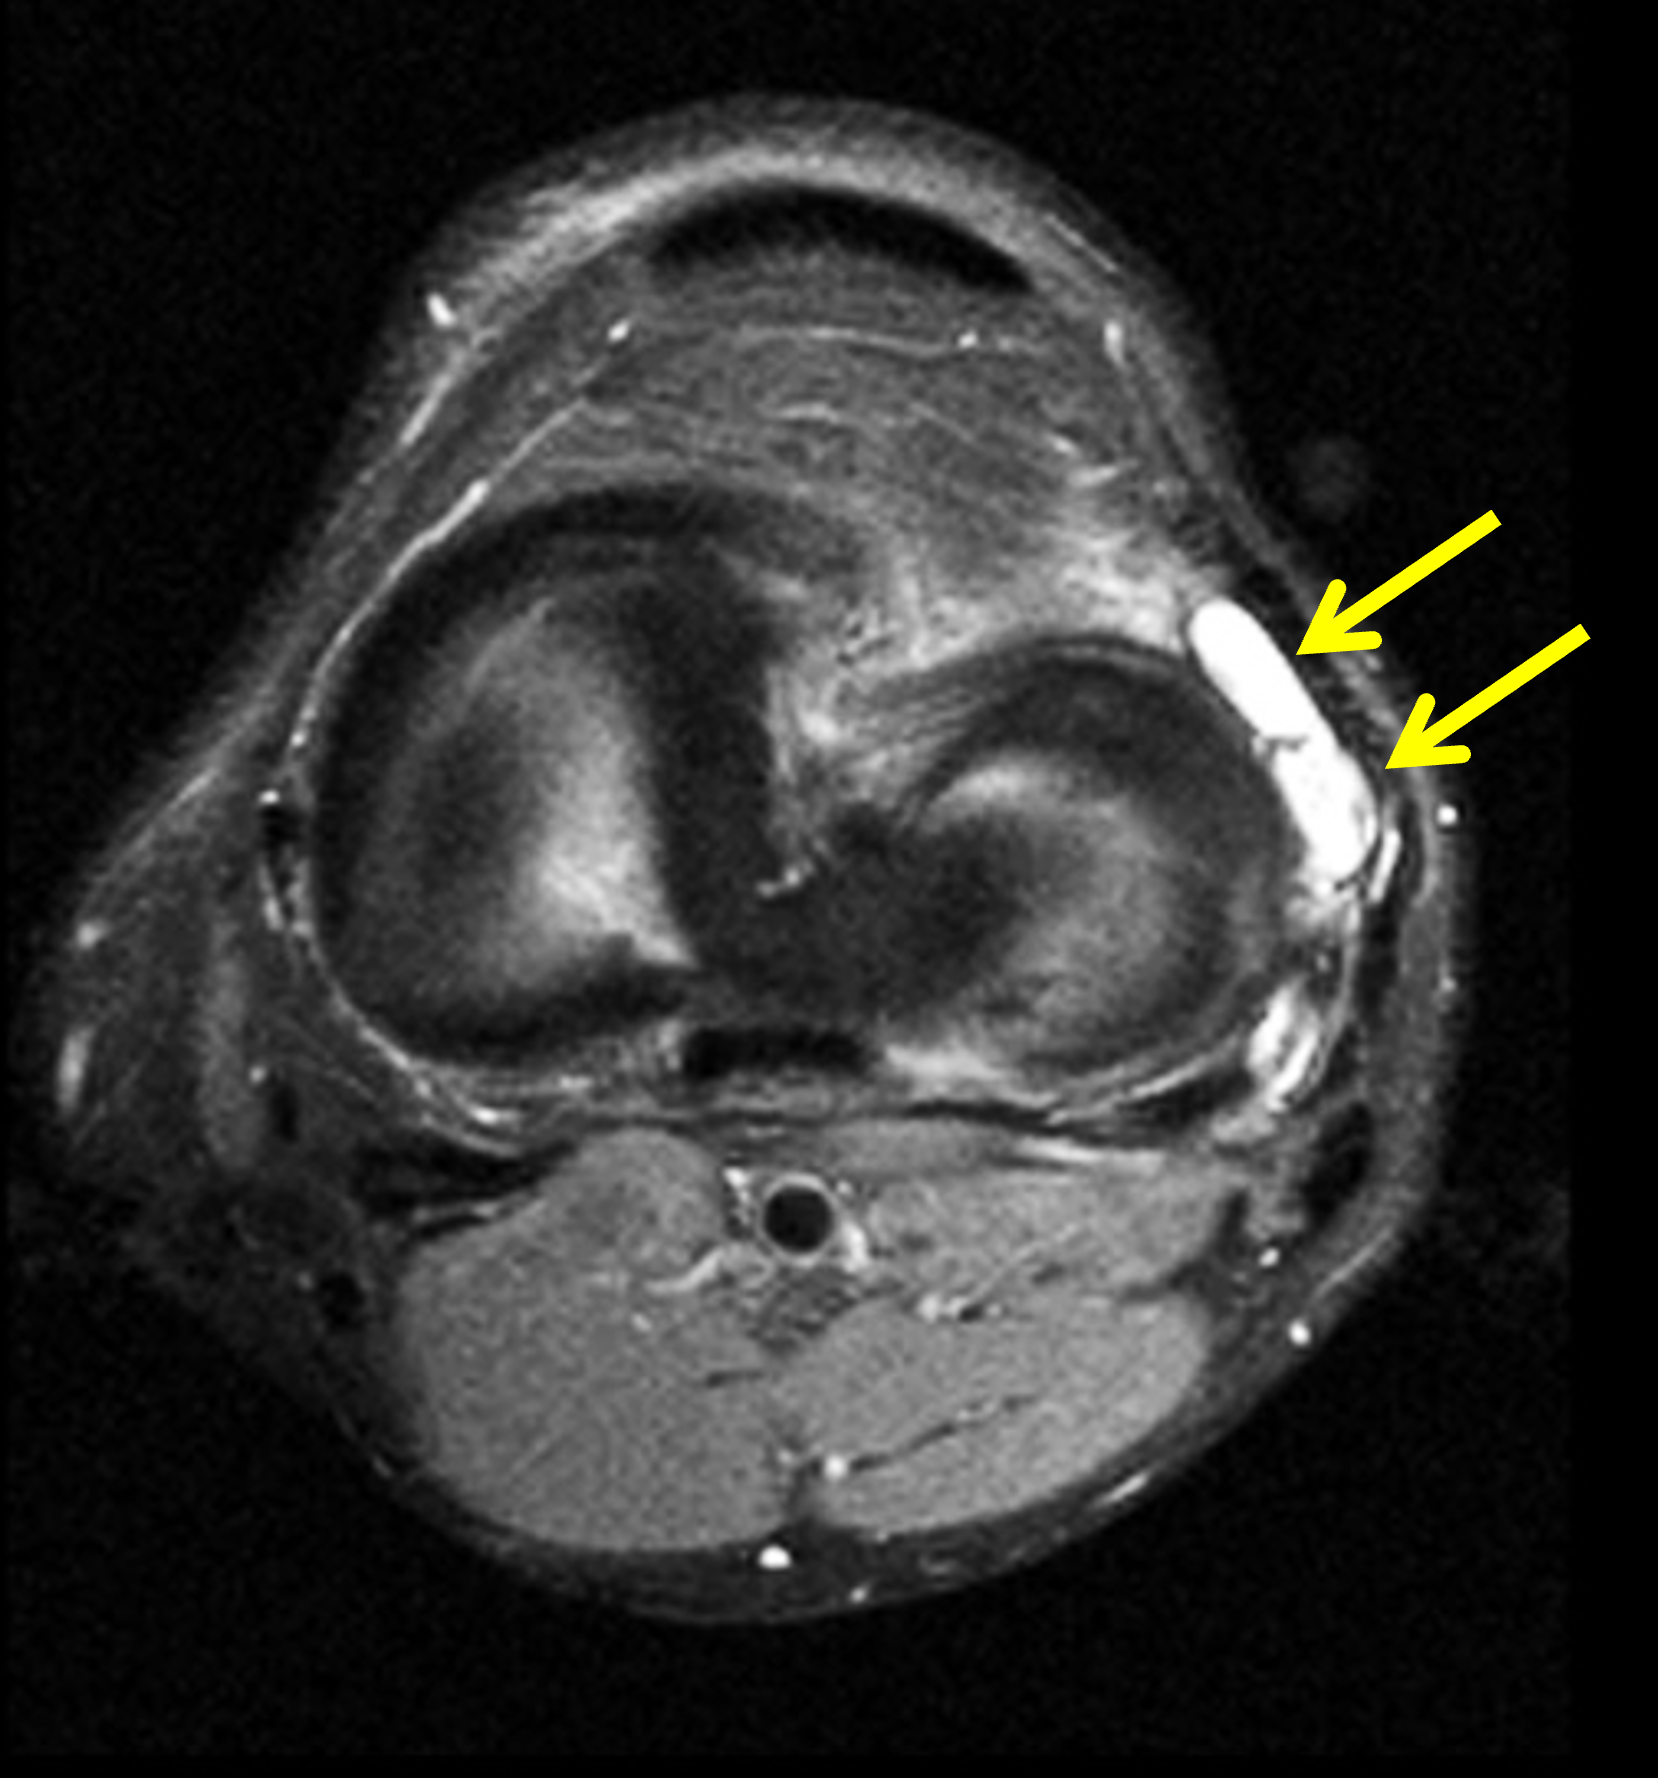
Figure 14: Lateral meniscal cyst in the knee. (14A) Coronal fat-suppressed, proton density-weighted image demonstrates a horizontal tear of the lateral meniscus body (arrowhead) communicating with an adjacent, multilocular cystic structure (arrow) centered at the joint line. (14B) Axial fat-suppressed, proton density-weighted image shows the cyst extending anteriorly (arrows) into the subcutaneous fat.
Bursae, particularly around the elbow, knee, and foot, may also present as palpable masses (Figures 15 and 16). Primary bursae are synovial-lined periarticular structures that contain variable amounts of fluid and serve to reduce motion or pressure-induced friction between periarticular structures and overlying soft tissues. Adventitial bursae are acquired fluid-filled soft tissue structures that develop at a pathologic or iatrogenic site of increased friction, often between bone or hardware and overlying soft tissues. Usually, the typical location and MR characteristics are enough to distinguish a bursa from another palpable abnormality. Bursae containing fluid may appear simple with homogenous fluid signal contents, or they may be complex and multiloculated with thin internal septations. Bursae containing proteinaceous or hemorrhagic material may demonstrate hyperintensity on T1-weighted images, while those containing calcification or hemosiderin may exhibit low signal on T1- and T2-weighted images. If intravenous contrast is administered, thin peripheral and/or thin septal enhancement is typical. No mass-like or nodular enhancement should be present. Bursae may contain chondroid or osteochondral bodies due to extruded joint bodies or chondroid metaplasia.28

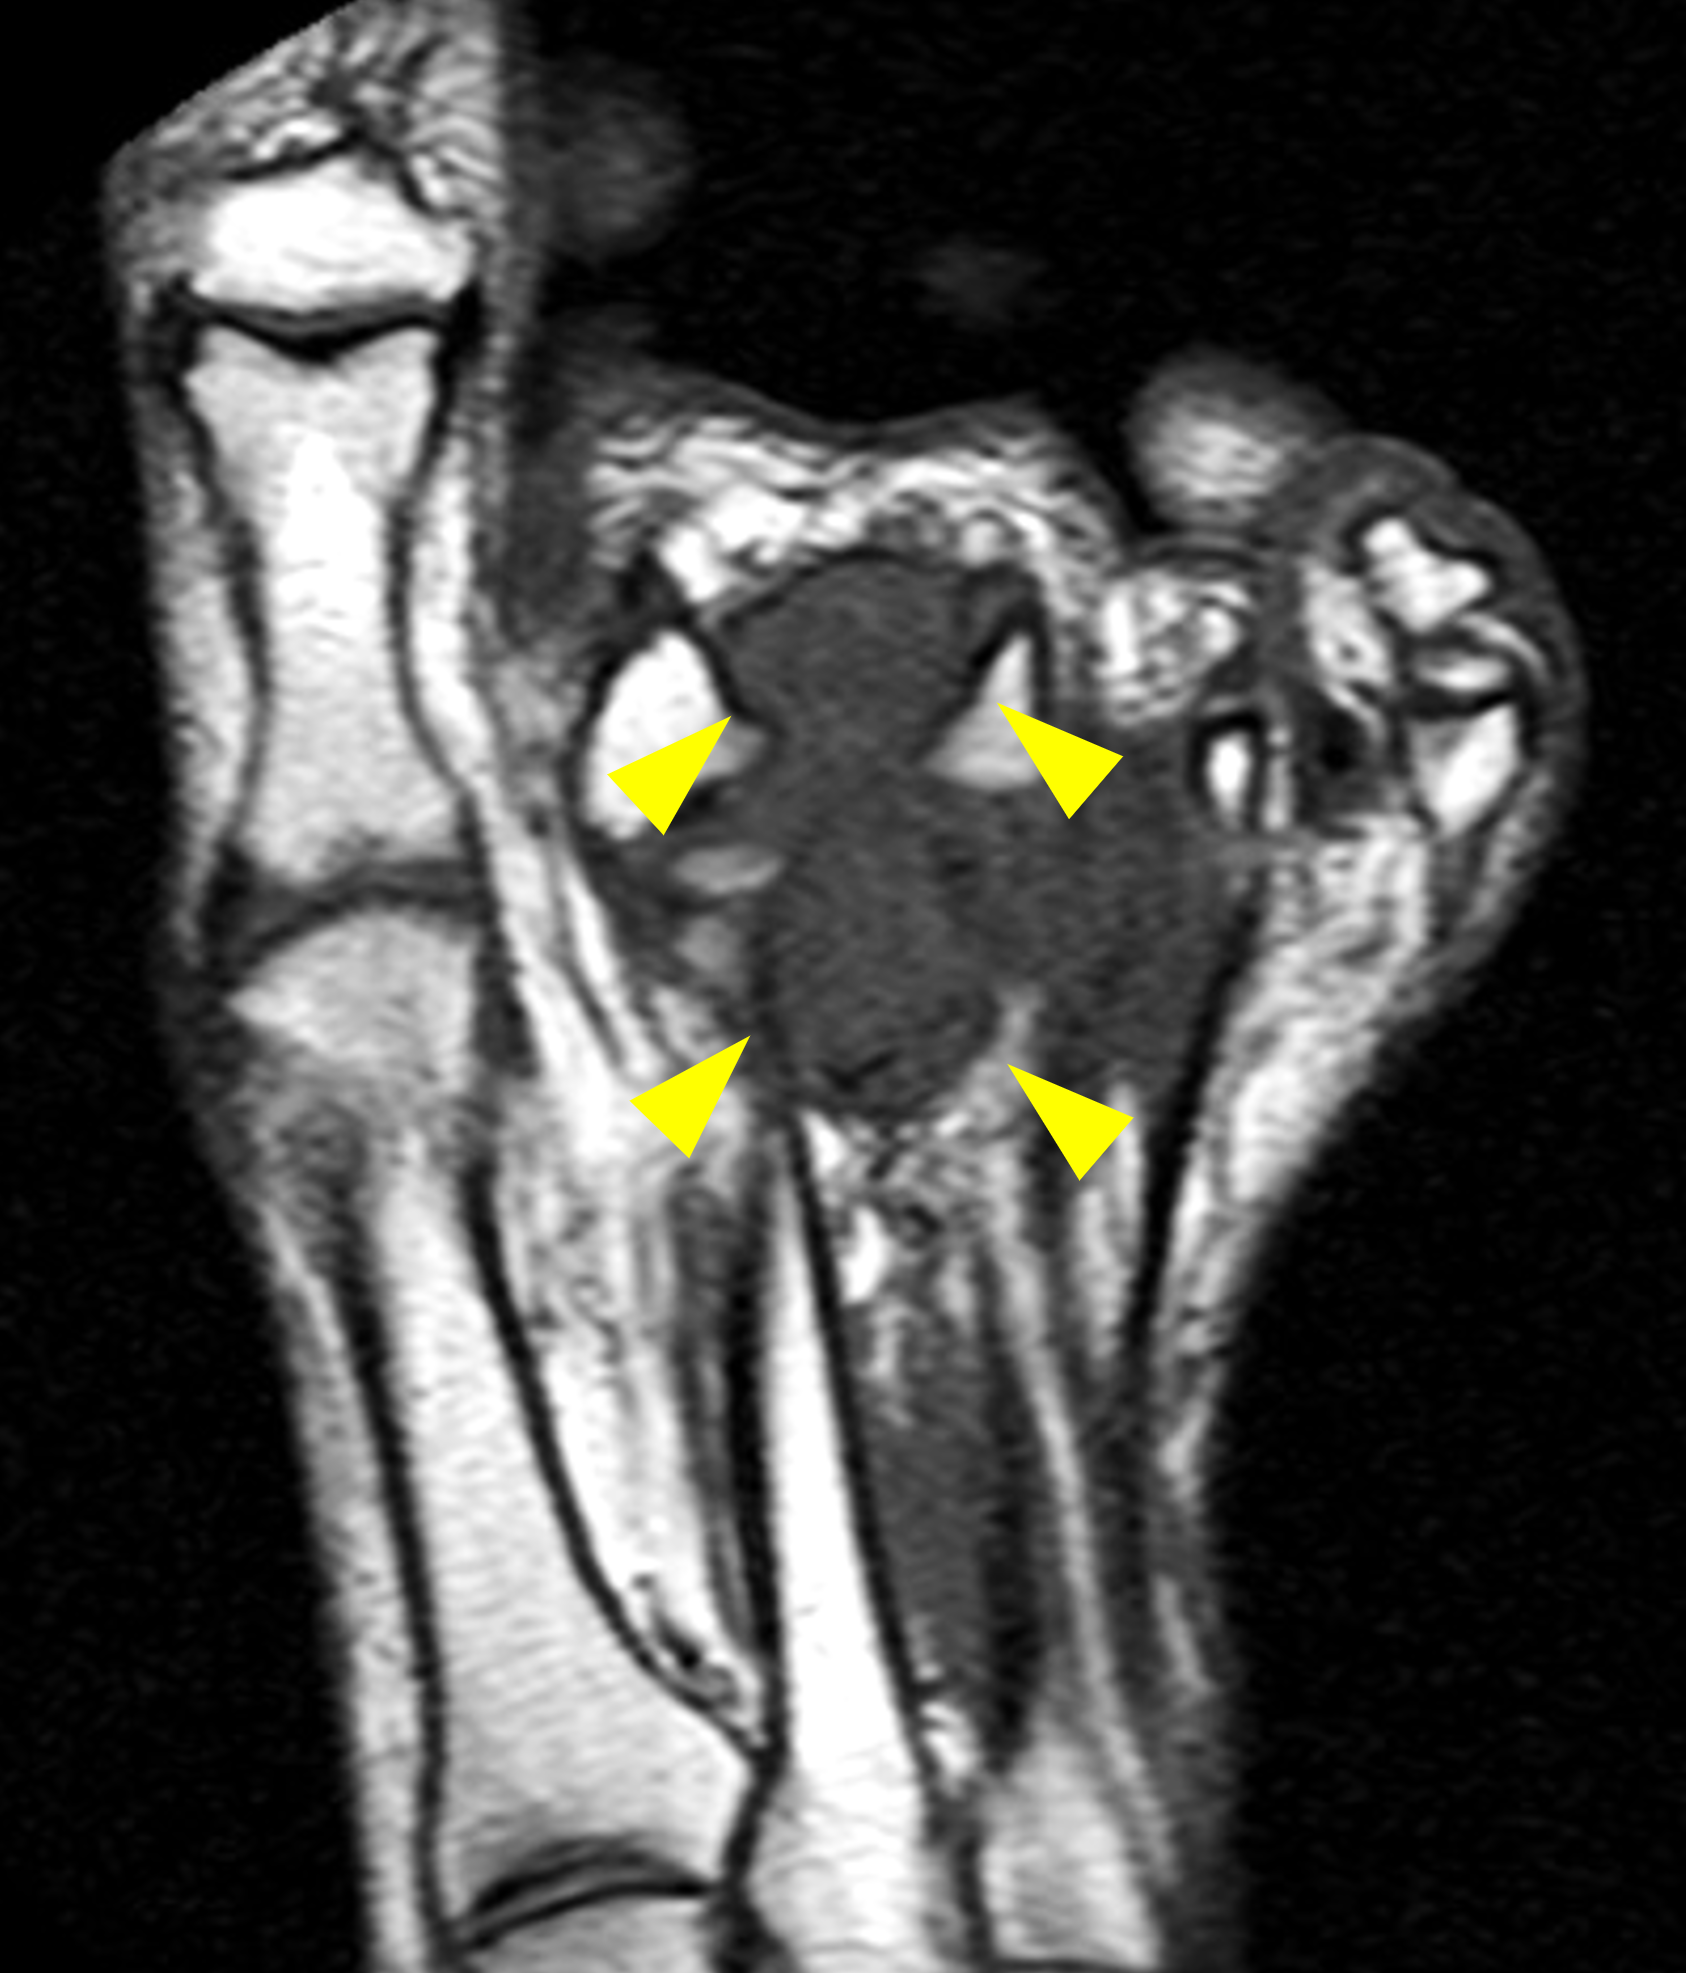
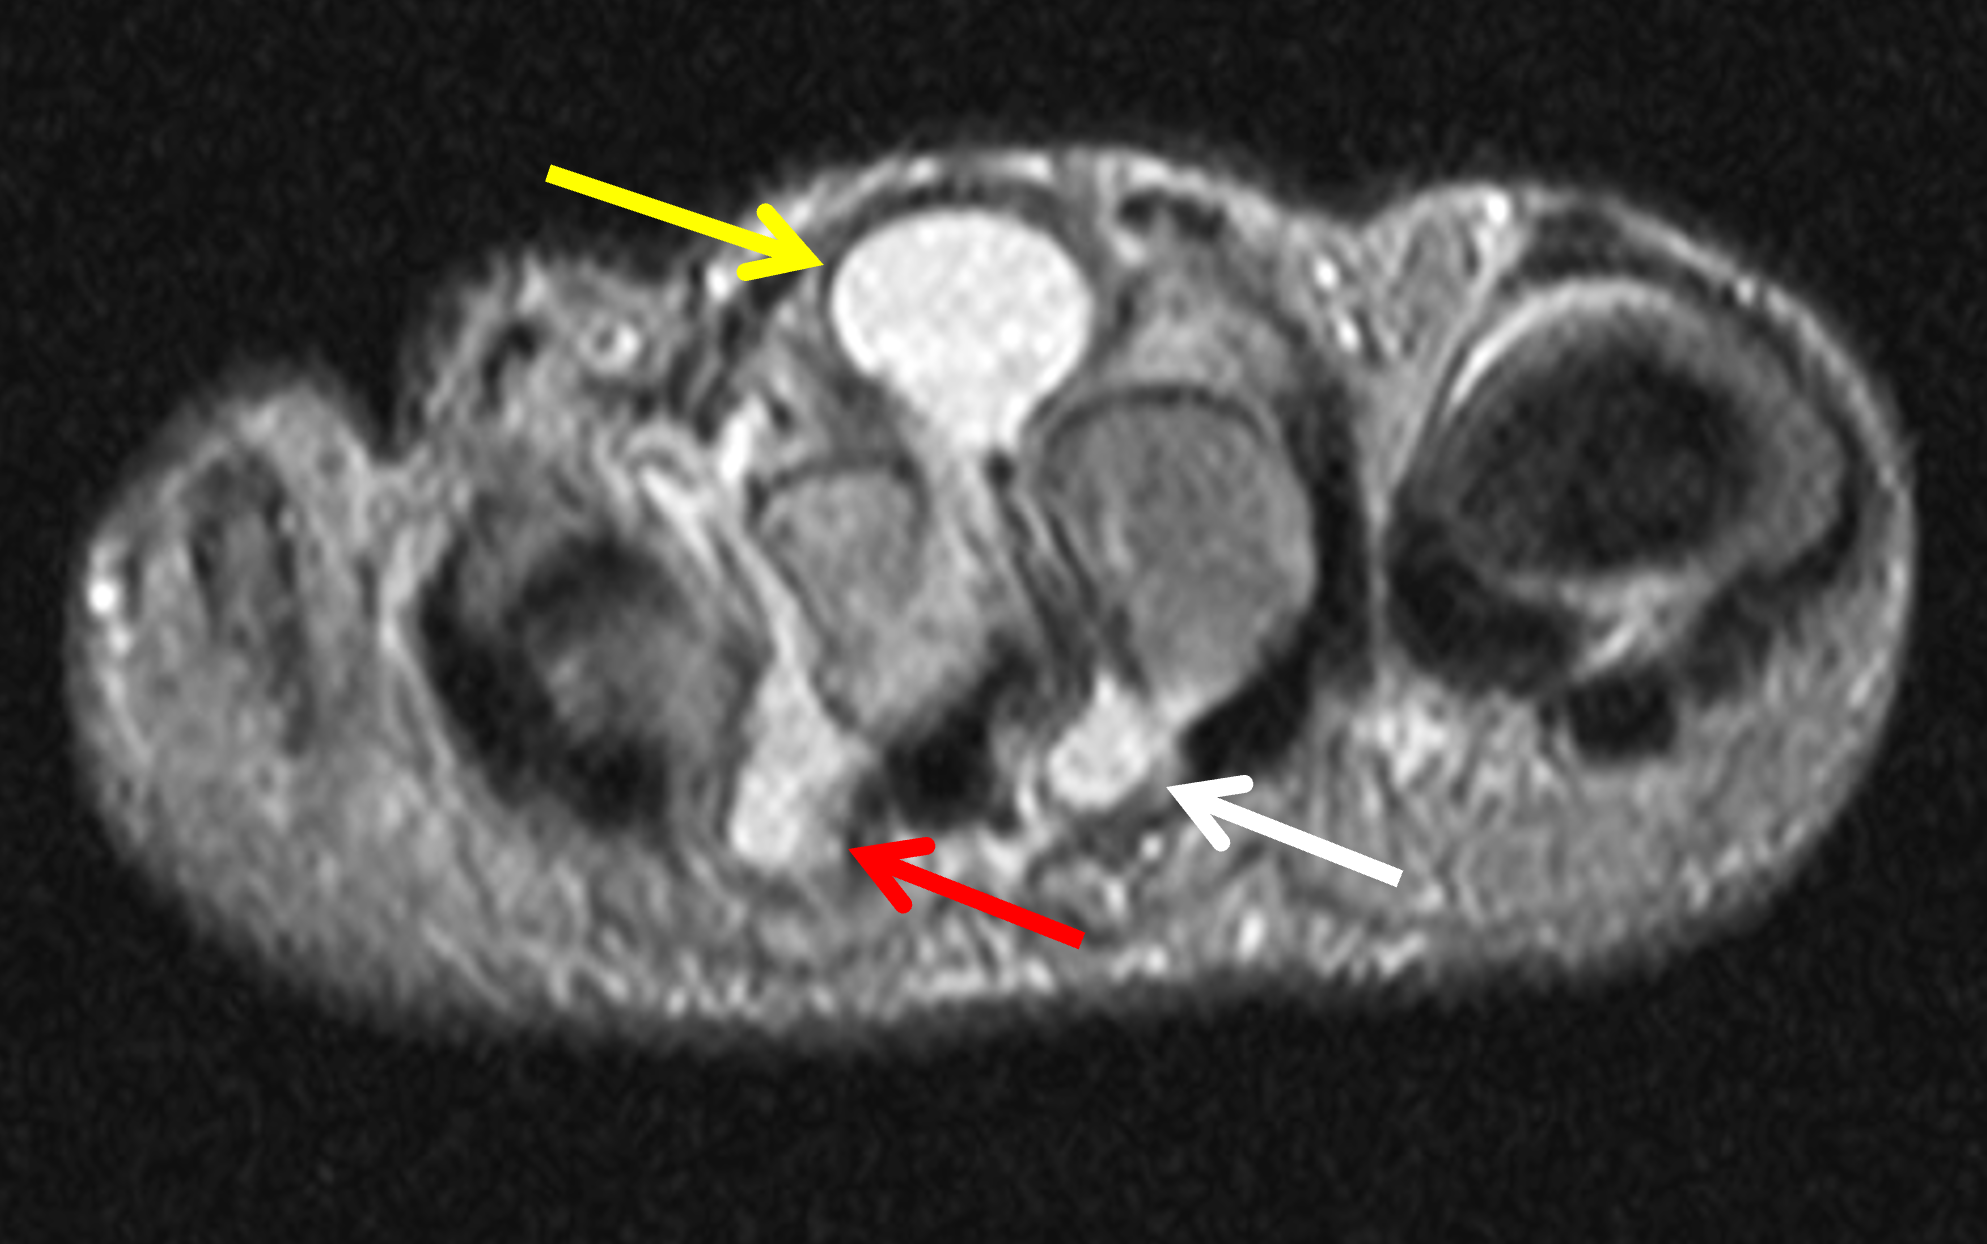
Figure 15: Intermetatarsal bursitis presenting as a palpable mass in the foot. (15A) Long axis STIR image shows a bilobed hyperintense but heterogeneous mass (arrows) along the dorsum of the forefoot. (15B) Long axis T1-weighted image demonstrates chronic pressure erosion of the metatarsals and phalanges (arrowheads) related to the long-standing bursitis. (15C) Short axis STIR image shows most of the fluid collection in the second webspace dorsal to the transverse metatarsal ligament, where it was palpable (yellow arrow). A smaller plantar component is present (white arrow). Mild intermetatarsal bursitis also involves the third webspace (red arrow).


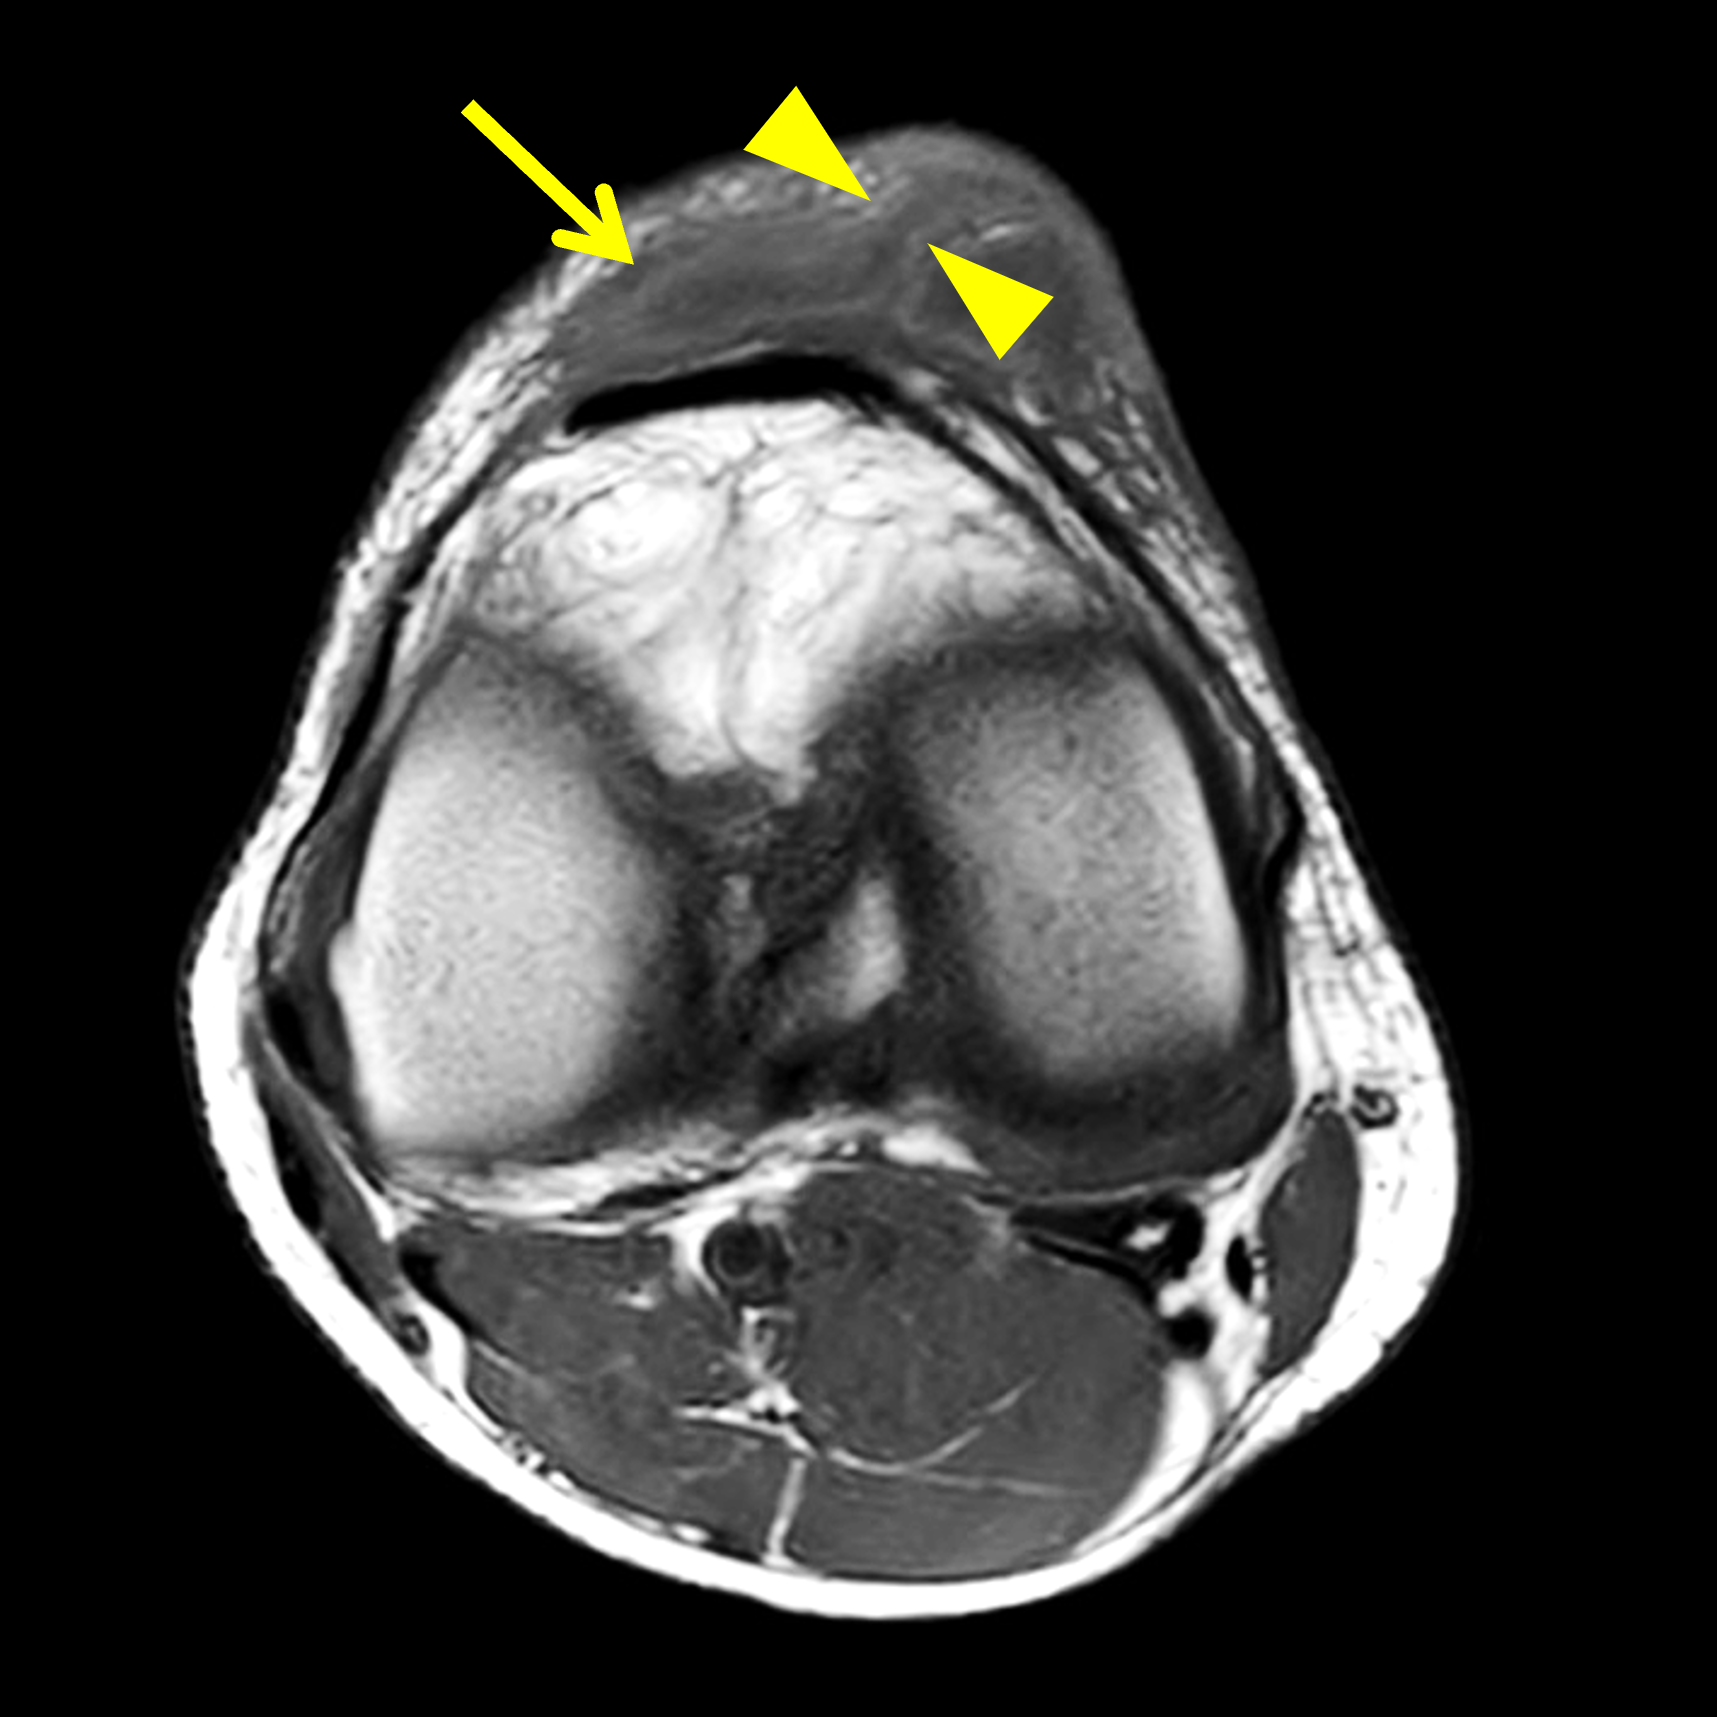

Figure 16: Chronic prepatellar and superficial infrapatellar bursitis with secondary infection. (16A) Sagittal T1-weighted image shows a low signal-intensity rim (yellow arrows) surrounding a prepatellar fluid collection indicating chronicity, and a high signal rim (red arrow) surrounding an infrapatellar collection representing a penumbra sign related to infection. (16B) Sagittal fat-suppressed, proton-density weighted image demonstrates heterogenous hyperintense fluid in the bursae (asterisks) and subcutaneous inflammation (arrow) surrounding the superficial infrapatellar bursa. (16C) Axial T1-weighted image shows the high signal intensity penumbra sign (arrow) and a draining sinus tract (between arrowheads). (16D) Axial fat-suppressed, proton density-weighted image shows a sinus tract (between arrowheads) draining to the skin.
As detailed in a previous Web Clinic, Morel-Lavallee lesions (closed degloving injuries) are another fluid-filled structure located in the deep subcutaneous tissues. These post-traumatic lesions result from soft tissue degloving injuries. Shearing forces separate the subcutaneous fat from the underlying fascia, disrupting crossing vessels and creating a potential space that fills with blood, lymph, debris, and fat. MRI is the imaging modality of choice in the evaluation of these post-traumatic fluid collections, which are typically located along the interface between deep subcutaneous fat and a fascial plane.29 Morel-Lavallee lesions are usually well-defined and may demonstrate fluid-fluid levels, septations, and variable signal intensity depending on the concentration of hemolymphatic fluid, acuity of the lesion, and presence of fat. The history, location, and shape of the lesion, conforming to that of the fascial plane, as well as the presence of internal fat globules allows confident diagnosis on MRI (Figure 17).

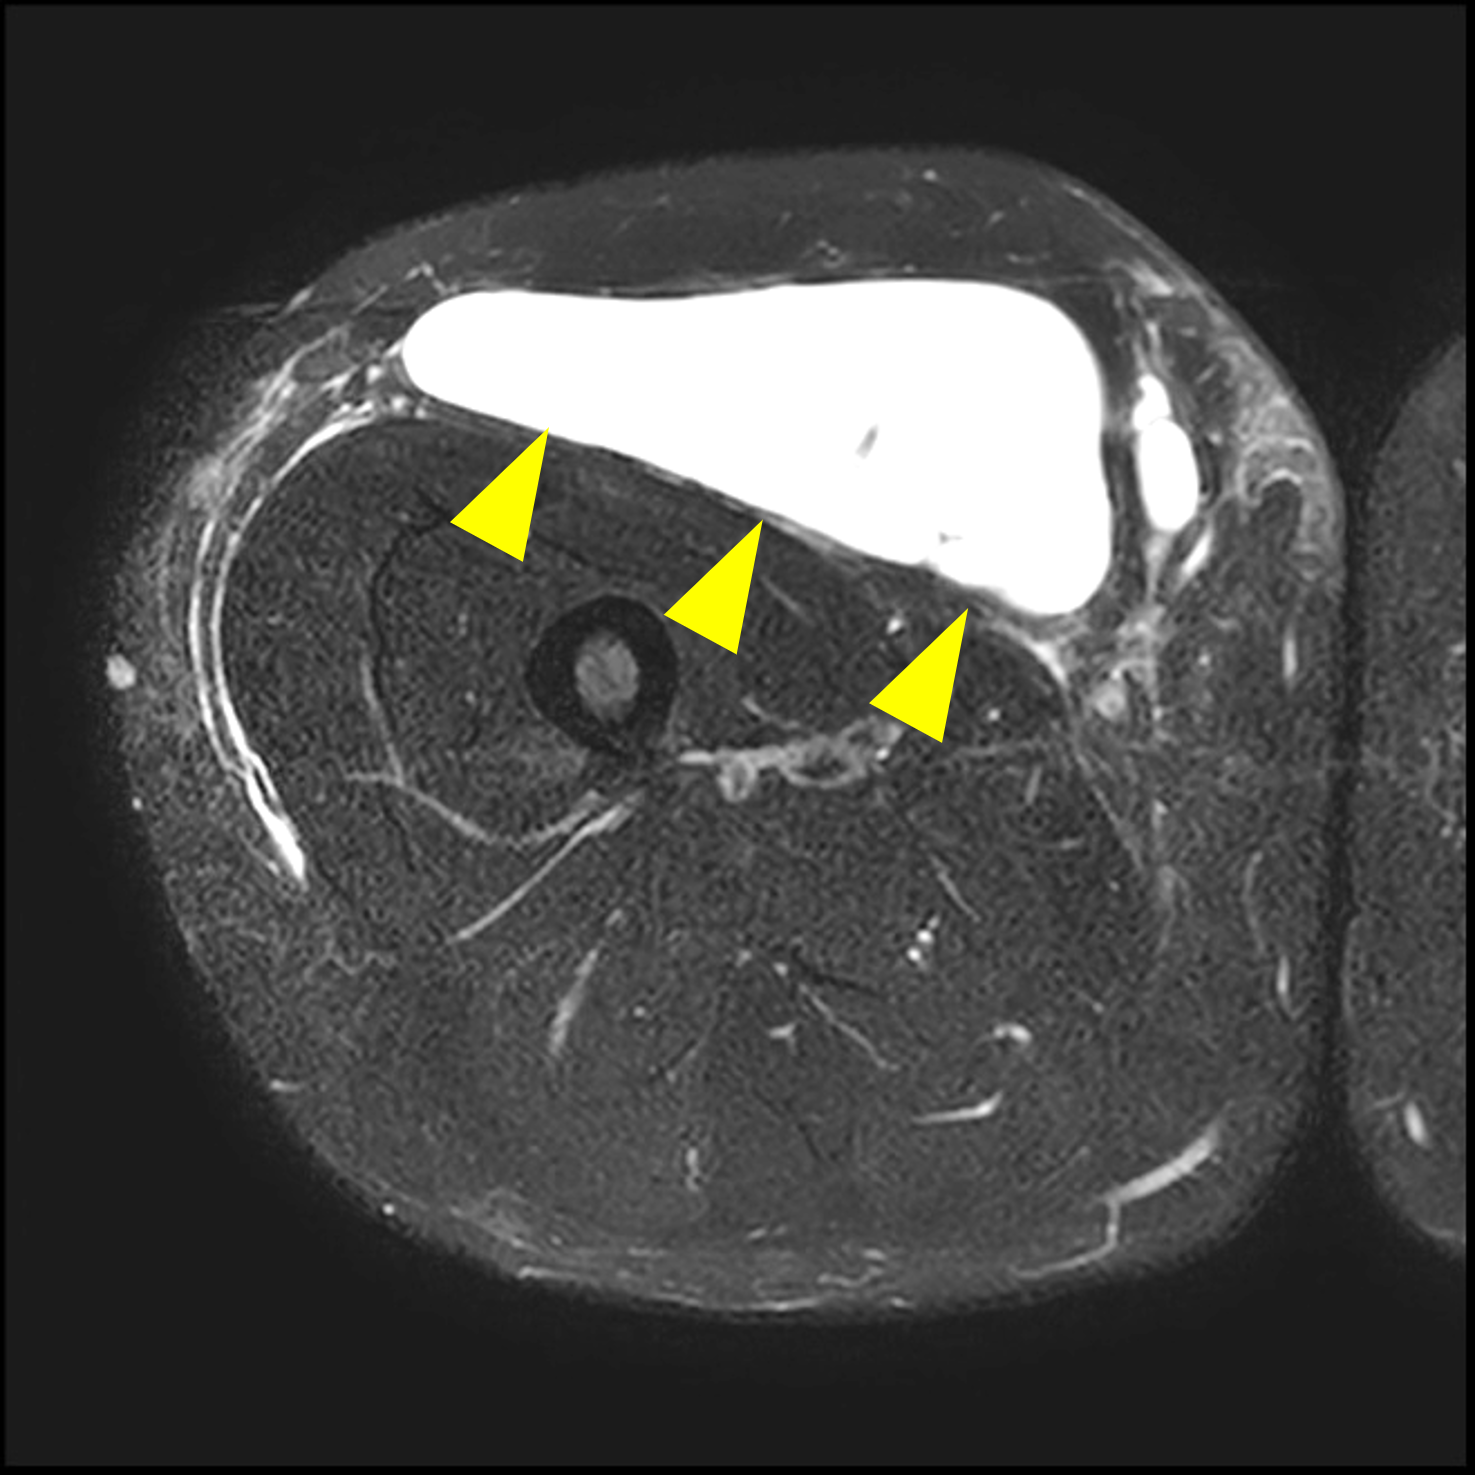
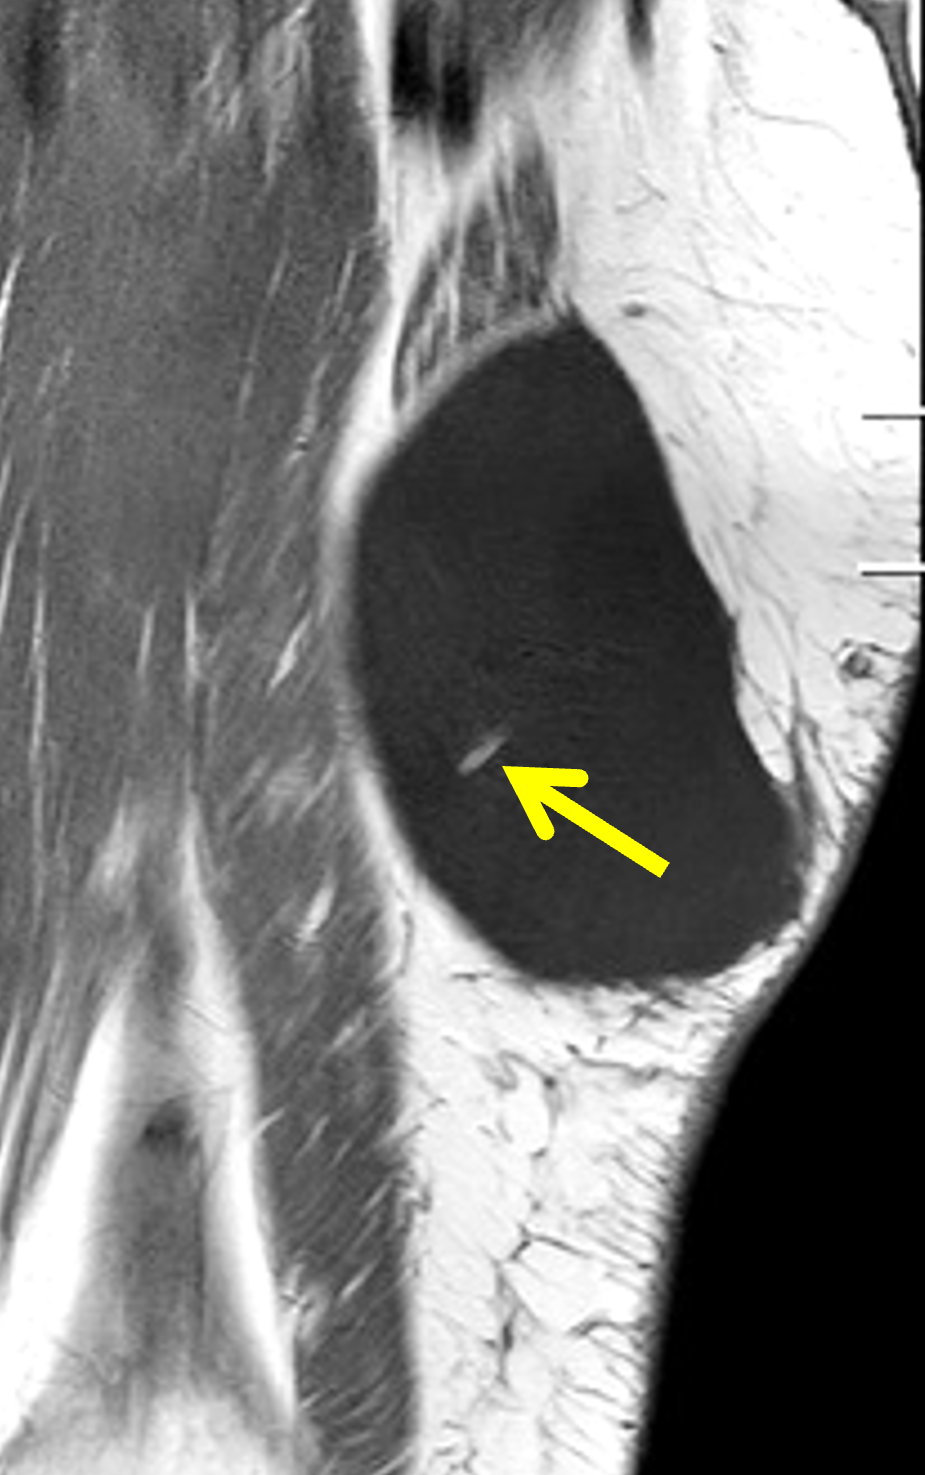
Figure 17: Anterior thigh Morel-Lavallee lesion following a motor vehicle collision. (17A) Axial T1-weighted image shows a circumscribed fluid collection, hypointense compared to skeletal muscle, at the interface between the subcutaneous fat and anterior compartment fascia (arrowheads). (17B) Axial fat-suppressed, T2-weighted image shows a fluid collection (arrowheads) in the deep aspect of the anterior subcutaneous fat. (17C) Coronal T1-weighted image demonstrates a focus of high signal-intensity fat (arrow) within the fluid collection.
Another benign lesion that demonstrates T2 hyperintensity and contains fat on MRI is a low-flow venous malformation, formerly called a hemangioma. Venous malformations are the most common vascular soft tissue abnormality and comprise of 7% of benign soft tissue tumors.30 Vascular malformations are classified according to the dominant distorted vessel type. The simple types are capillary, lymphatic and venous malformations. Combined types include arteriovenous fistula and arteriovenous malformations, as well as combinations of capillary, lymphatic, arterial and venous components, which include capillary venous, capillary lymphatic venous, lymphatic venous, capillary arterial venous and capillary lymphatic arterial venous malformations.31 Vascular malformations are also divided into low-flow and high-flow subtypes, which is particularly important when choosing a treatment algorithm. Venous malformations have variable presentations ranging from small, localized, superficial lesions to large, infiltrative lesions with poorly defined margins that cross soft tissue planes. On MRI, fluid-sensitive images demonstrate high signal-intensity lobules or tubules with fibrofatty septa (Figure 18). In larger lesions, vascular channels, fluid-fluid levels, phleboliths, or thrombosis may be evident. Avid enhancement of the lobules occurs after contrast administration.
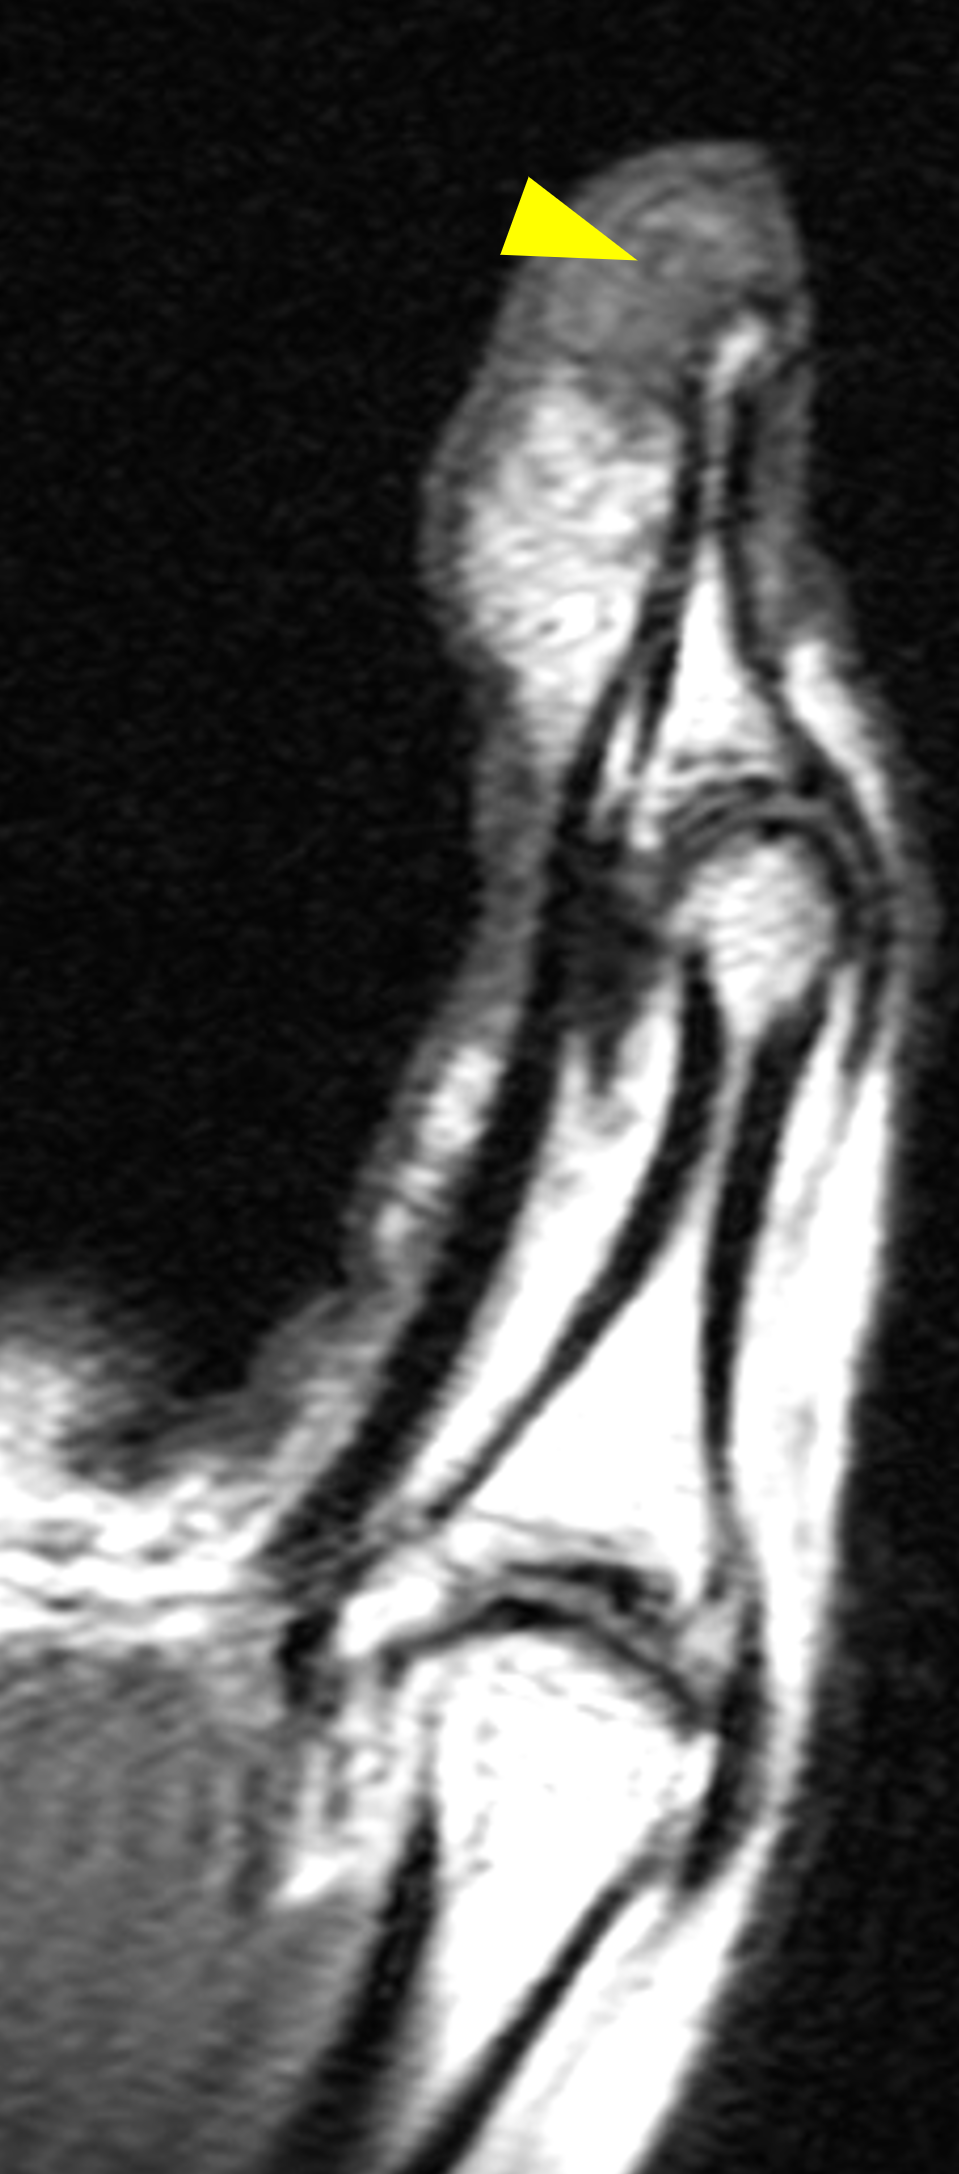
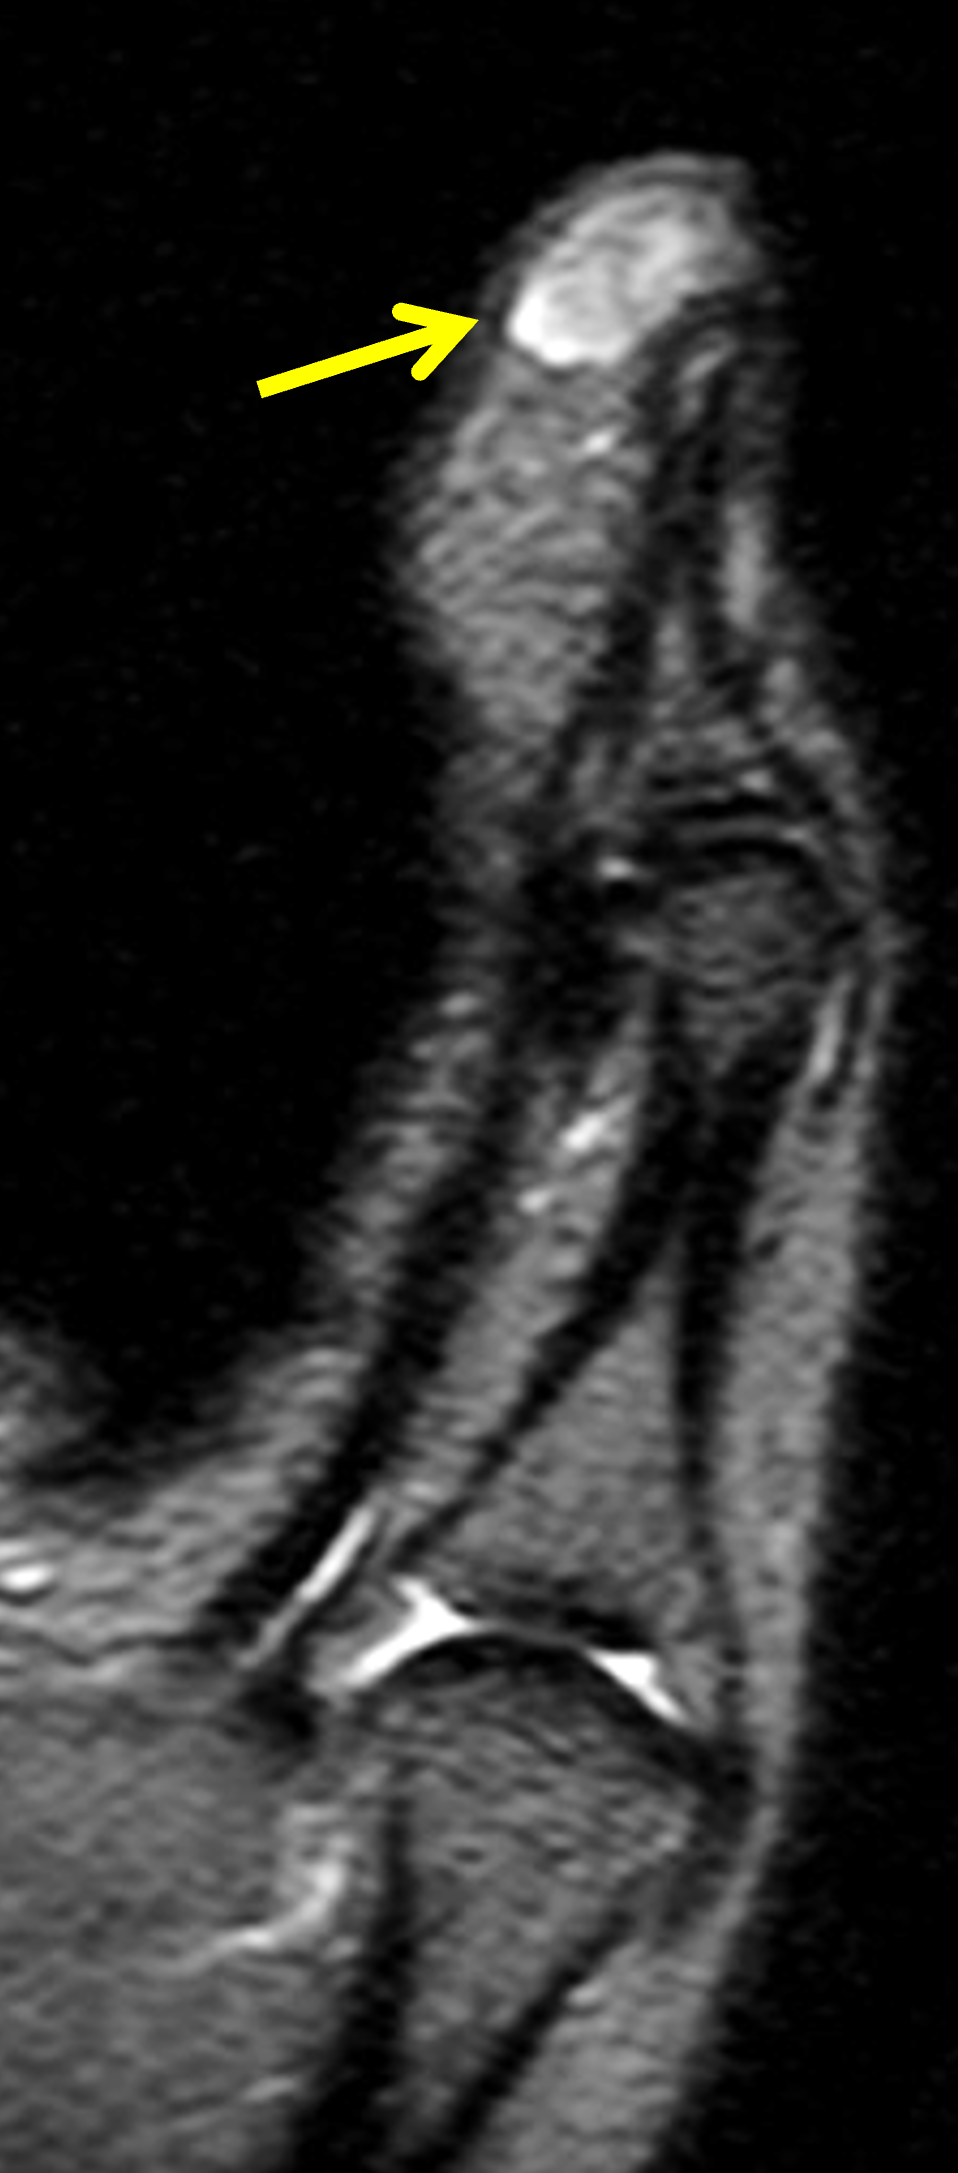
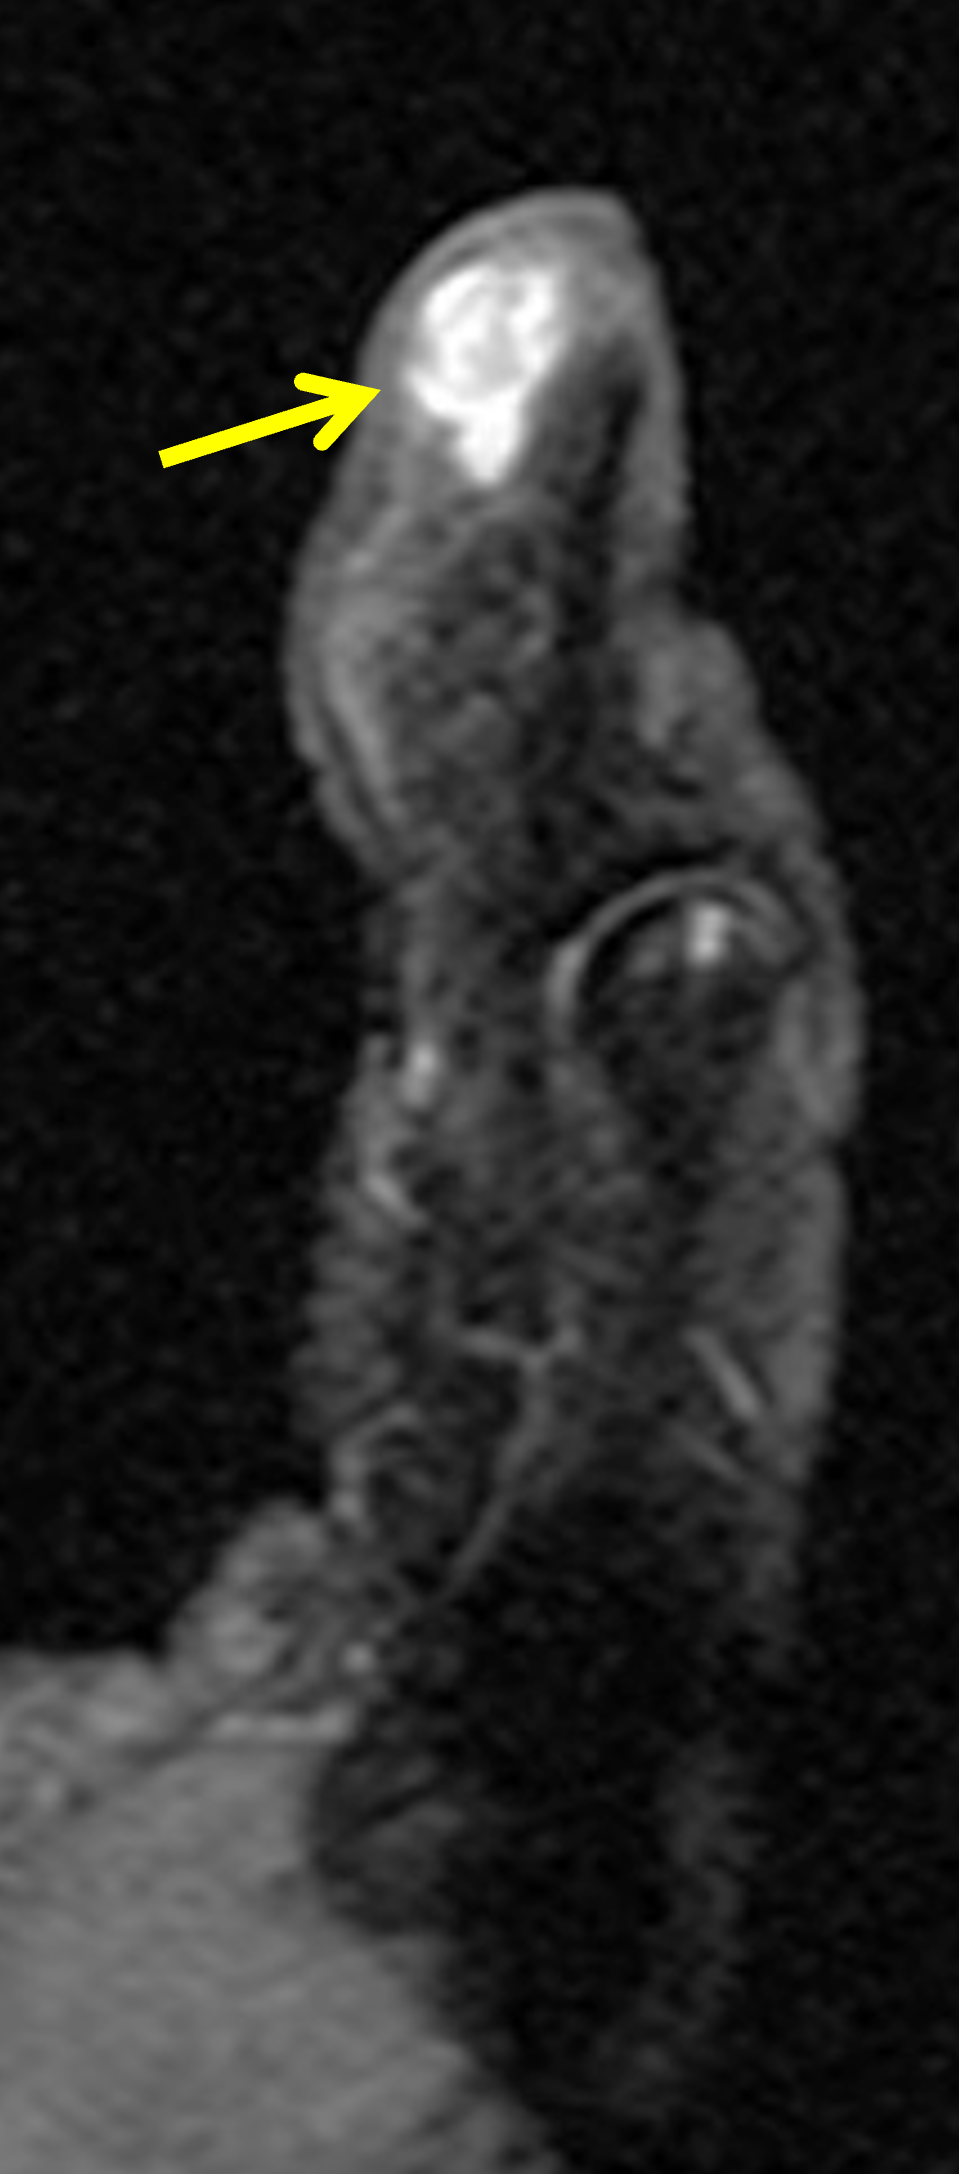
Figure 18: Biopsy-proved, subcutaneous capillary hemangioma (low-flow venous malformation) in the distal thumb. (18A) Sagittal T1-weighted image demonstrates a lesion with mildly lobulated contours, isointense compared to skeletal muscle, with small foci of internal fat (arrowhead) in the palmar subcutaneous fat. (18B) Sagittal STIR image demonstrates a hyperintense lesion (arrow) containing internal low-signal intensity streaks representing fibrofatty septa. (18C) Sagittal fat-suppressed, T1-weighted image acquired following intravenous contrast administration demonstrates lobular, intense enhancement (arrow).
T2 hyperintense solid lesions mimicking fluid-containing structures
When evaluating soft tissue lesions, it is important to remember that some solid masses may be T2-hyperintense, mimicking cysts and fluid-filled structures. Myxoid soft tissue tumors are a heterogenous group of benign and malignant lesions that produce mucoid/myxoid matrix.32 Due to their high water content, myxoid lesions demonstrate fluid-like T2 hyperintense signal. Similarly, benign nerve sheath tumors and highly cellular tumors may appear uniformly high signal on fluid-sensitive sequences. When in doubt due to the appearance or location of a lesion, or because of atypical clinical history, administration of intravenous contrast can help distinguish true cysts from solid or partially-solid lesions (Figure 19). Diffuse, nodular, lacy, or patchy post-contrast internal enhancement should not be present in a simple cyst and suggests a myxoid or highly cellular neoplasm. Myxoid tumors may be benign, such as a myxoma, or malignant, such as myxoid liposarcoma, myxofibrosarcoma, and myxoid pleomorphic sarcoma. Larger size (greater than 7 cm), heterogeneity on T1-weighted images, and greater enhancement are more suggestive of malignancy.33 A prior Web Clinic covers intramuscular myxomas as well as a variety of other benign and malignant myxoid lesions in detail.
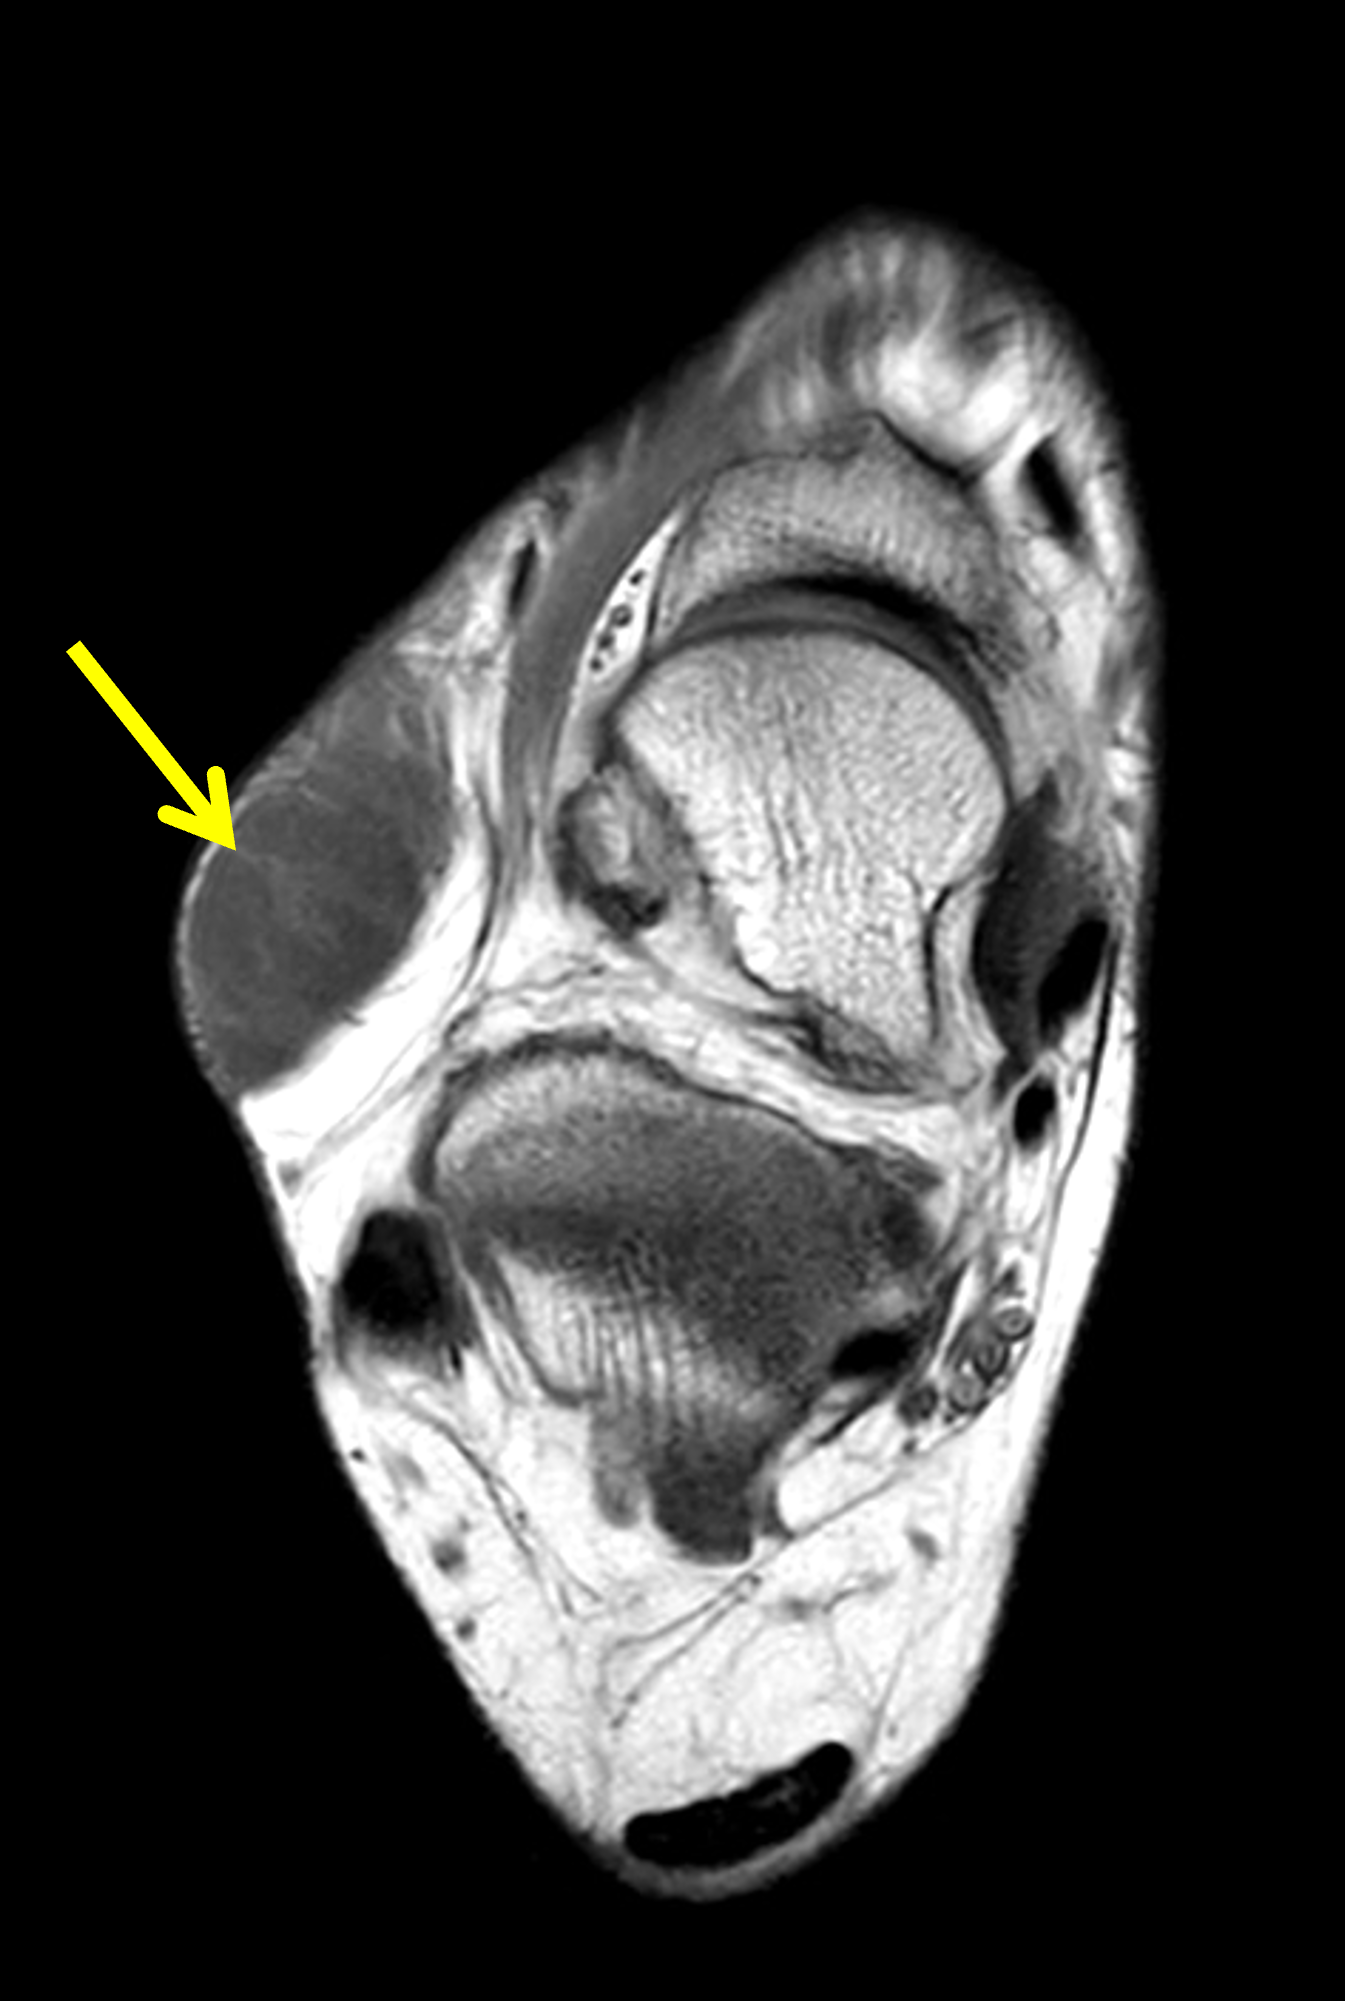


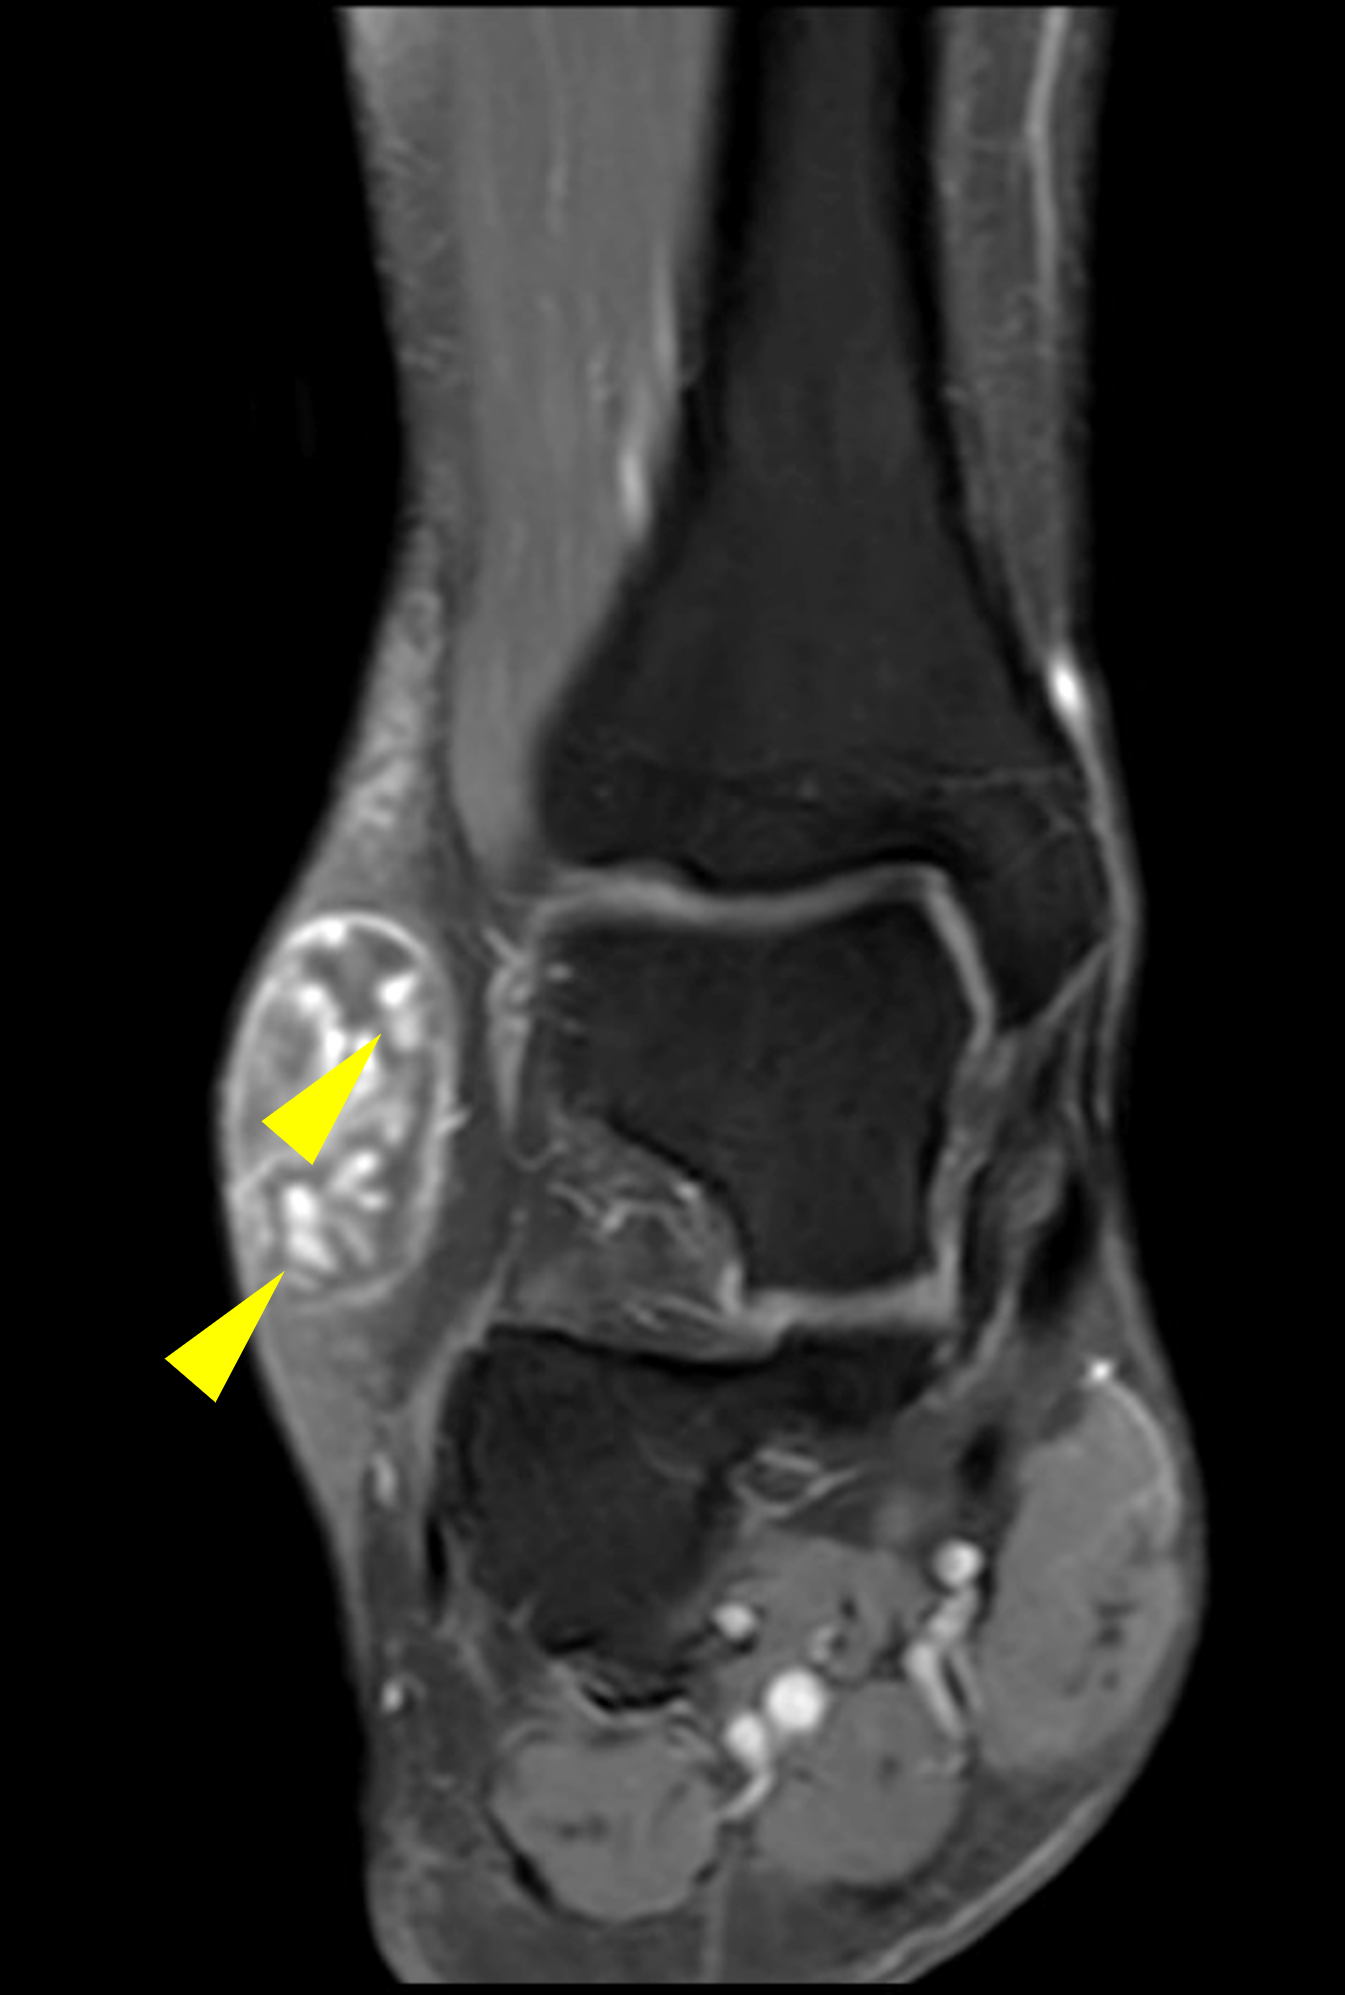
Figure 19: Subcutaneous myxoid neoplasm in the lateral ankle mimicking a cyst. (19A) Axial T1-weighted image shows a subcutaneous mass primarily isointense compared with skeletal muscle (arrow). (19B) Axial fat-suppressed, T2-weighted image shows nearly uniform internal high signal intensity in the mass (arrow). (19C) Coronal fat-suppressed, T2-weighted image reveals internal heterogeneity, with lower signal-intensity internal structures (arrows). (19D) Coronal fat-suppressed, T1-weighted image following intravenous contrast administration demonstrates heterogenous internal nodular enhancement (arrowheads), indicating that the mass is solid, not cystic, despite its appearance on the fluid-sensitive sequences.
Malignant Until Proven Otherwise
MRI features of soft-tissue masses that are suggestive of malignancy include infiltrative margins, invasion of adjacent structures including bone or neurovascular structures, size greater than 5 cm, deep location, heterogenous internal signal intensity, intralesional necrosis or hemorrhage, early post-contrast enhancement, or nodular/heterogenous enhancement (Figure 20). However, the presence of many of these features is variable and some benign tumors and inflammatory lesions may show some of these features.34,35 Additionally, the absence of these findings does not exclude malignancy. If MR characteristics are not pathognomonic for a fluid-filled structure or a benign etiology, orthopedic oncology referral, histologic sampling, short-term follow-up, or further evaluation with additional imaging, such as PET/CT may all be considered.
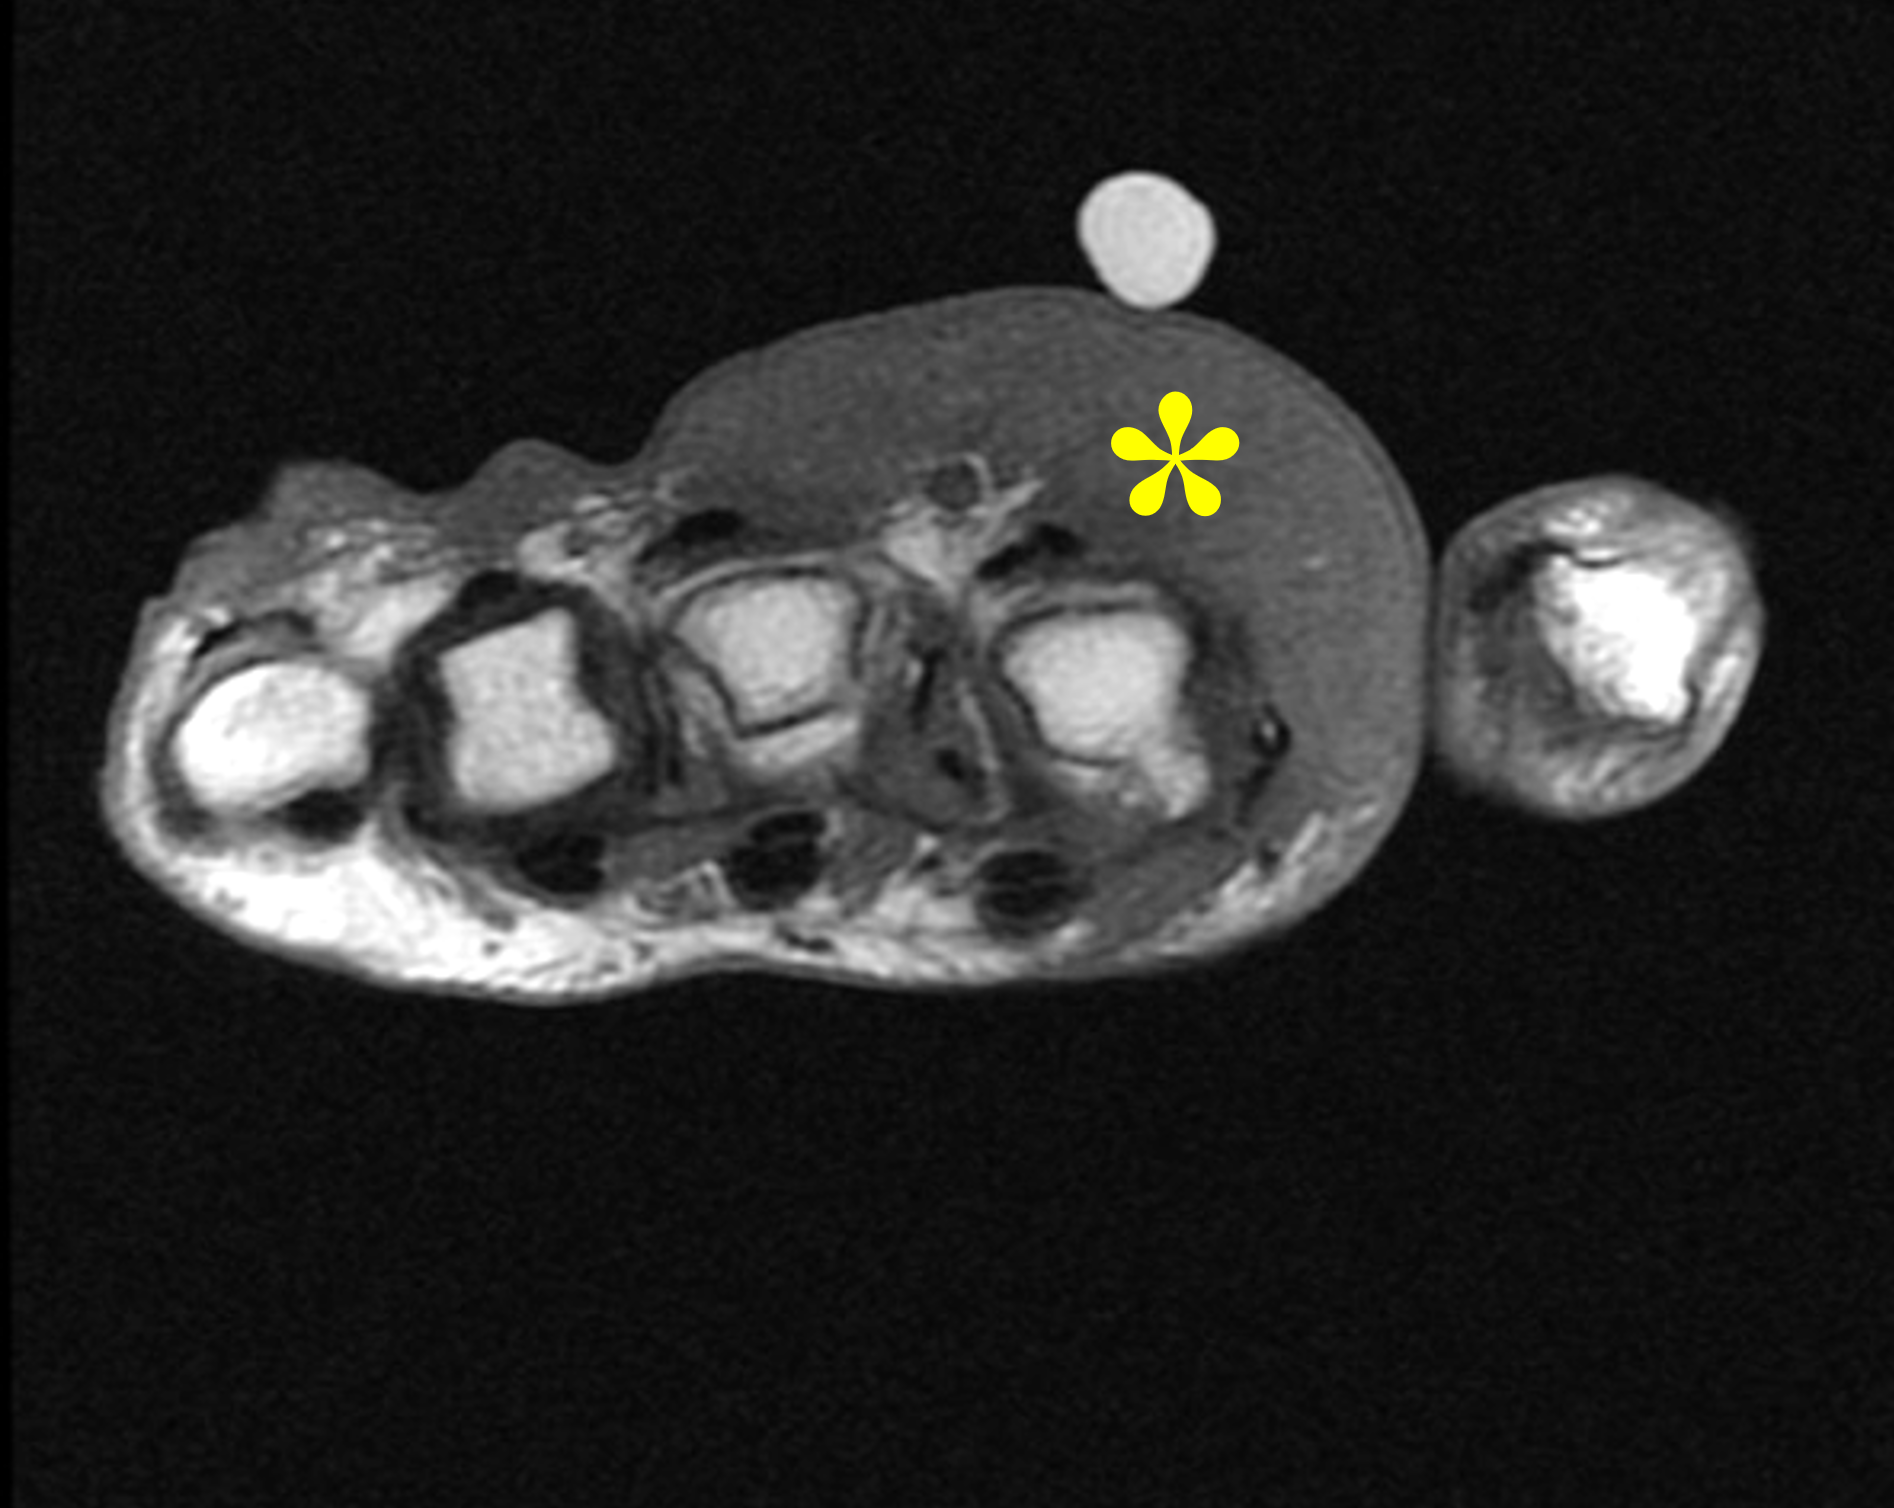
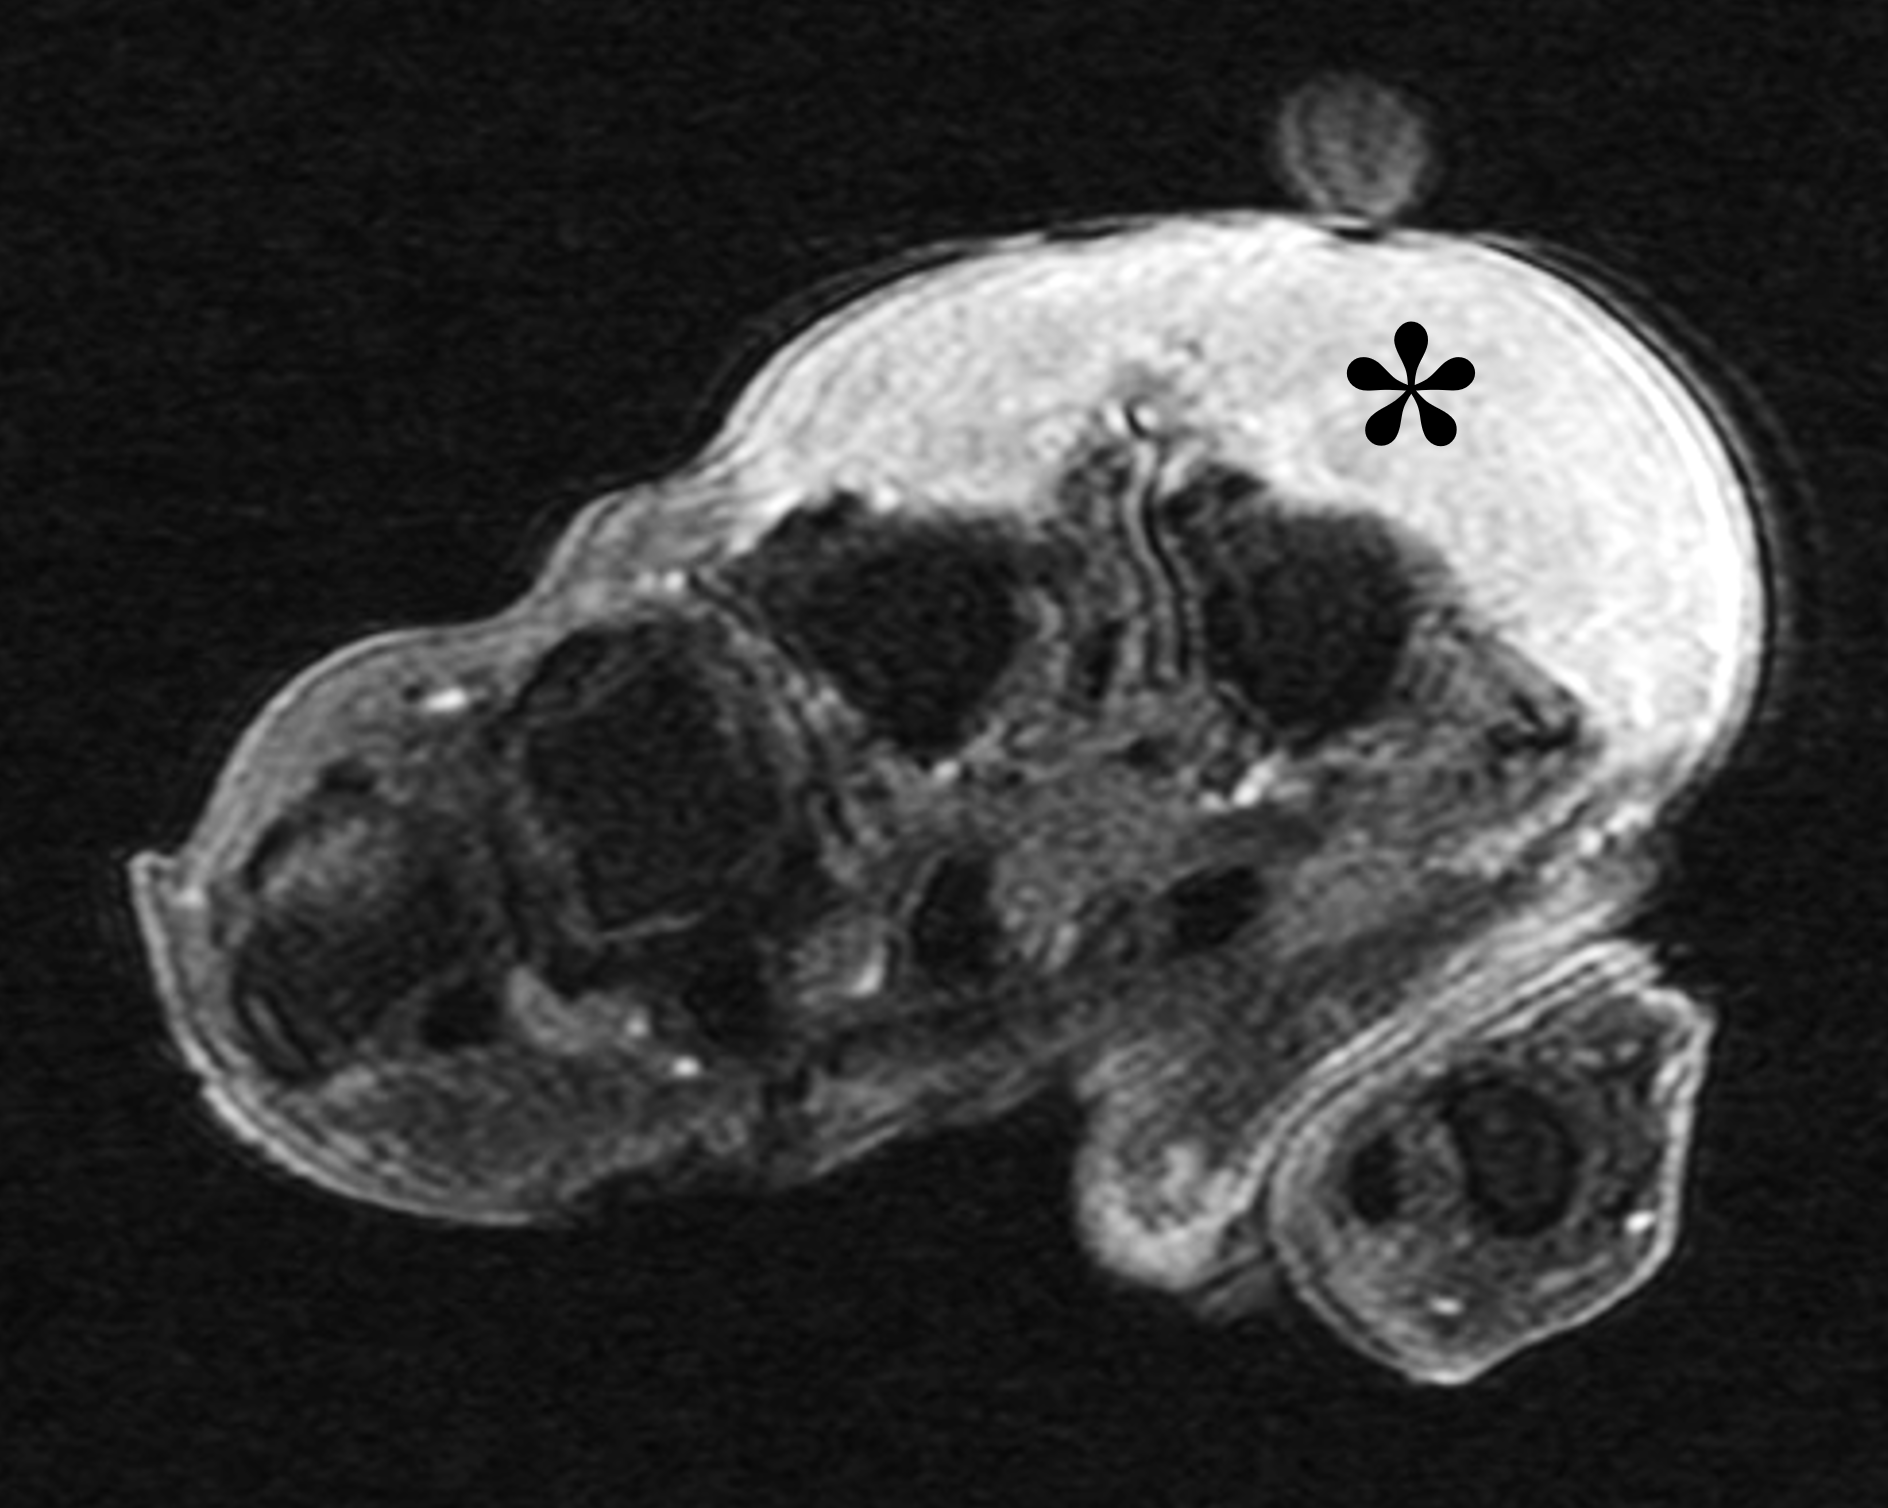
Figure 20: Subcutaneous mass in the dorsoradial hand with nonspecific features suggesting malignancy. (20A) Axial T1-weighted image shows a large soft tissue mass (asterisk), isointense compared to skeletal muscle, occupying the entire width of the subcutaneous compartment with infiltrative margins. (20B) Axial fat-suppressed, T1-weighted image acquired following intravenous contrast administration demonstrates diffuse avid internal enhancement (asterisk). While non-specific, this appearance cannot be due to a cyst, and is concerning for primary skin-based malignancy, sarcoma, or lymphoma. Further evaluation with biopsy is recommended.
Conclusion
An epidermoid inclusion cyst presents as a palpable, typically painless subcutaneous mass, with characteristic MRI features including close proximity to the skin, fluid-like signal intensity with internal keratin and debris, a thin fibrous capsule, and lack of internal enhancement. Multiple other lesions also occur in the subcutaneous tissues with high signal intensity on fluid-sensitive sequences, but with other imaging characteristics that allow differentiation from epidermoid inclusion cysts. Many of these entities are discussed in this Web Clinic, although the list is not exhaustive. It is important for the interpreting radiologist to become familiar with the various MRI features of subcutaneous, palpable masses to help guide diagnosis and management.
References
- Bullough P. Orthopedic pathology. 4th ed. New York, NY: Mosby; 2004. ↩
- McLendon RE. Epidermoid and dermoid tumors. In: Wilkins RHR, S.S., editor. Neurosurgery. 2nd ed. New York, NY: McGraw-Hill; 1996. p. 959–963. ↩
- Fisher AR, Mason PH, Wagenhals KS. Ruptured plantar epidermal inclusion cyst. AJR Am J Roentgenol. 1998;171(6):1709–1710. doi:10.2214/ajr.171.6.9843324 ↩
- Vincent LM, Parker LA, Mittelstaedt CA. Sonographic appearance of an epidermal inclusion cyst. J Ultrasound Med. 1985;4(11):609–611. doi:10.7863/jum.1985.4.11.609 ↩
- Houdek MT, Warneke JA, Pollard CM, Lindgren EA, Taljanovic MS. Giant epidermal cyst of the gluteal region. Radiol Case Rep. 2010;5(4):476. doi:10.2484/rcr.v5i4.476 ↩
- Weir CBSH, N.J. Epidermal Inclusion Cyst. {Updated 2023 Aug 8}. In: StatPearls {Internet}. Treasure Island (FL): StatPearls Publishing; 2026 Jan-. Available from: https://www.ncbi.nlm.nih.gov/books/NBK532310/. ↩
- Chiu MY, Ho ST. Squamous cell carcinoma arising from an epidermal cyst. Hong Kong Med J. 2007;13(6):482–484. ↩
- Bauer BS, Lewis VL, Jr. Carcinoma arising in sebaceous and epidermoid cysts. Ann Plast Surg. 1980;5(3):222–226. doi:10.1097/00000637-198009000-00008 ↩
- Low SF, Sridharan R, Ngiu CS. Giant epidermal cyst with intramuscular extension: a rare occurrence. BMJ Case Rep. 2015;2015. doi:10.1136/bcr-2013-202534 ↩
- Kim HK, Kim SM, Lee SH, Racadio JM, Shin MJ. Subcutaneous epidermal inclusion cysts: ultrasound (US) and MR imaging findings. Skeletal Radiol. 2011;40(11):1415–1419. doi:10.1007/s00256-010-1072-4 ↩
- Brenner JS, Cumming WA, Ros PR. Testicular epidermoid cyst: sonographic and MR findings. AJR Am J Roentgenol. 1989;152(6):1344. doi:10.2214/ajr.152.6.1344-a ↩
- Hong SH, Chung HW, Choi JY, Koh YH, Choi JA, Kang HS. MRI findings of subcutaneous epidermal cysts: emphasis on the presence of rupture. AJR Am J Roentgenol. 2006;186(4):961–966. doi:10.2214/AJR.05.0044 ↩
- Murphey MD, Smith WS, Smith SE, Kransdorf MJ, Temple HT. From the archives of the AFIP. Imaging of musculoskeletal neurogenic tumors: radiologic-pathologic correlation. Radiographics. 1999;19(5):1253–1280. doi:10.1148/radiographics.19.5.g99se101253 ↩
- Wang XL, De Schepper AM, Vanhoenacker F, De Raeve H, Gielen J, Aparisi F, et al. Nodular fasciitis: correlation of MRI findings and histopathology. Skeletal Radiol. 2002;31(3):155–161. doi:10.1007/s00256-001-0462-z ↩
- Sakaki M, Hirokawa M, Wakatsuki S, Sano T, Endo K, Fujii Y, et al. Acral myxoinflammatory fibroblastic sarcoma: a report of five cases and review of the literature. Virchows Arch. 2003;442(1):25–30. doi:10.1007/s00428-002-0723-9 ↩
- Torreggiani WC, Al-Ismail K, Munk PL, Nicolaou S, O’Connell JX, Knowling MA. Dermatofibrosarcoma protuberans: MR imaging features. AJR Am J Roentgenol. 2002;178(4):989–993. doi:10.2214/ajr.178.4.1780989 ↩
- Chhabra A, Soldatos T. Soft-tissue lesions: when can we exclude sarcoma? AJR Am J Roentgenol. 2012;199(6):1345–1357. doi:10.2214/AJR.12.8719 ↩
- Manaster BJ. Soft-tissue masses: optimal imaging protocol and reporting. AJR Am J Roentgenol. 2013;201(3):505–514. doi:10.2214/AJR.13.10660 ↩
- Wu JS, Hochman MG. Soft-tissue tumors and tumorlike lesions: a systematic imaging approach. Radiology. 2009;253(2):297–316. doi:10.1148/radiol.2532081199 ↩
- Bradley WG, Jr. MR appearance of hemorrhage in the brain. Radiology. 1993;189(1):15–26. doi:10.1148/radiology.189.1.8372185 ↩
- Davies AM, Hall AD, Strouhal PD, Evans N, Grimer RJ. The MR imaging appearances and natural history of seromas following excision of soft tissue tumours. Eur Radiol. 2004;14(7):1196–1202. doi:10.1007/s00330-004-2255-y ↩
- Alaia EF, Chhabra A, Simpfendorfer CS, Cohen M, Mintz DN, Vossen JA, et al. MRI nomenclature for musculoskeletal infection. Skeletal Radiol. 2021;50(12):2319–2347. doi:10.1007/s00256-021-03807-7 ↩
- McGuinness B, Wilson N, Doyle AJ. The “penumbra sign” on T1-weighted MRI for differentiating musculoskeletal infection from tumour. Skeletal Radiol. 2007;36(5):417–421. doi:10.1007/s00256-006-0267-1 ↩
- Masuoka S, Hiyama T, Ishiguro T, Saida T, Kano S, Miyazaki O, et al. Practical Imaging Approach to Determining the Cause of Nonneoplastic Lymphadenopathy. Radiographics. 2025;45(11):e240147. doi:10.1148/rg.240147 ↩
- Goldsmith S, Yang SS. Magnetic resonance imaging in the diagnosis of occult dorsal wrist ganglions. J Hand Surg Eur Vol. 2008;33(5):595–599. doi:10.1177/1753193408092041 ↩
- Burk DL, Jr., Dalinka MK, Kanal E, Schiebler ML, Cohen EK, Prorok RJ, et al. Meniscal and ganglion cysts of the knee: MR evaluation. AJR Am J Roentgenol. 1988;150(2):331–336. doi:10.2214/ajr.150.2.331 ↩
- Campbell SE, Sanders TG, Morrison WB. MR imaging of meniscal cysts: incidence, location, and clinical significance. AJR Am J Roentgenol. 2001;177(2):409–413. doi:10.2214/ajr.177.2.1770409 ↩
- Torreggiani WC, Al-Ismail K, Munk PL, Roche C, Keogh C, Nicolaou S, et al. The imaging spectrum of Baker’s (Popliteal) cysts. Clin Radiol. 2002;57(8):681–691. doi:10.1053/crad.2001.0917 ↩
- Mellado JM, Bencardino JT. Morel-Lavallee lesion: review with emphasis on MR imaging. Magn Reson Imaging Clin N Am. 2005;13(4):775–782. doi:10.1016/j.mric.2005.08.006 ↩
- Allen PW, Enzinger FM. Hemangioma of skeletal muscle. An analysis of 89 cases. Cancer. 1972;29(1):8–22. doi:10.1002/1097-0142(197201)29:1<8::aid-cncr2820290103>3.0.co;2-a ↩
- Enjolras O. Classification and management of the various superficial vascular anomalies: hemangiomas and vascular malformations. J Dermatol. 1997;24(11):701–710. doi:10.1111/j.1346-8138.1997.tb02522.x ↩
- Graadt van Roggen JF, Hogendoorn PC, Fletcher CD. Myxoid tumours of soft tissue. Histopathology. 1999;35(4):291–312. doi:10.1046/j.1365-2559.1999.00835.x ↩
- Harish S, Lee JC, Ahmad M, Saifuddin A. Soft tissue masses with “cyst-like” appearance on MR imaging: Distinction of benign and malignant lesions. Eur Radiol. 2006;16(12):2652–2660. doi:10.1007/s00330-006-0267-5 ↩
- Kransdorf MJ, Murphey MD. Radiologic evaluation of soft-tissue masses: a current perspective. AJR Am J Roentgenol. 2000;175(3):575–587. doi:10.2214/ajr.175.3.1750575 ↩
- Lin EC. Malignant versus benign soft tissue lesions. In: Lin ECE, E.J.; Garg, K.D.; Bleicher, A.G.; Alexander, D., editor. Practical differential diagnosis for CT and MRI. New York, NY: Thieme; 2008. p. 268–269. ↩
